Buy Vishal Mega Mart Ltd for the Target Rs. 160 by Emkay Global Financial Services Ltd

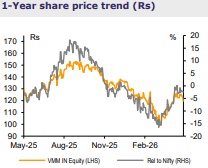
We maintain BUY on VMM while pulling down our TP by ~6% to Rs160 (55x FY28E EPS; unchanged) from Rs170. VMM saw healthy acceleration with 22% topline growth in Q4 (~13% SSG), albeit seeing a slight EBITDA miss of 3-4% due to increased promotions/inventory liquidation, ahead of the new season launch. VMM’s topline grew ~20% and EBITDA margin inched up by ~70bps, helping drive the targeted ~30% PAT growth in FY26. VMM remains optimistic about sustaining its double-digit SSG trends, on the back of healthy new customer additions and higher basket sizes/premiumization within existing customers. Despite the inflationary environment, VMM remains committed to preserving the entry price-points and maintaining its meaningful price discount (vs branded category leaders); this should reinforce VMM's value perception and support continued market-share gains, in our view. Initial traction in the under-penetrated South/West India and the small-format store pilot for lowertier cities is encouraging, and progressing per expectations. Both combined grant confidence on continued annual retail space expansion of 10-11%. Balance sheet strength improved further with ~Rs17bn net cash at FY26-end (vs Rs8.5bn at FY25-end), 50% RoIC (ex-Goodwill) in FY26 (FY25: ~42%).
Topline growth robust; increased promotions/inventory liquidation impact GM
VMM continued its strong topline momentum in Q4, with ~22% YoY growth to Rs31.1bn (1.5% ahead of our estimate), supported by a healthy adjusted SSG of 13.2% (reported SSG: 12.1%) and the rest via store additions. Revenue mix has seen improvement, with the apparel/general merchandise mix up by ~100/30bps YoY. However, GM dipped by ~50bps to 27.8% in Q4 (lower than our estimate of 28.4%), due to increased promotions and liquidation of old inventory before Q1, which is a big season for the clothing industry. EBITDA margin stands at 13.6%, down by ~40bps due to decline in gross margin (GM) and higher other expenses (up by ~40bps), partially offset by lower employee/ESOP expenses (down by ~20bps/40bps, respectively). Reported EBITDA at Rs4.2bn was up ~19% while pre-IndAS; pre-ESOP EBITDA at Rs2.75bn was up ~32% (8.8% margin; up by 60bps). For FY26, revenue growth was robust with ~20% growth, with pre-IndAS EBITDA margin up by 70bps to 9.8% (up ~30% YoY). Store additions remained healthy, with 24/99 net additions in Q4/FY26; this improved the total store-count to 795
Unit economics maintained in tier 2 and beyond cities
VMM continued to see healthy unit economics across its network, with stores in tier 2 and beyond markets delivering revenue-per-sqft, store-level EBITDA, and RoCE metrics comparable to that of stores in larger cities. The company added 13 small-format stores in FY26, and is seen achieving productivity levels on per-sqft basis akin to larger formats, thus supporting deeper penetration into new markets. For regions, Kerala performed better than the network average; performance in GJ and MH was in-line, despite being relatively new territories (6 stores each in both states). In Karnataka, VMM undertook store-size rationalization across several locations, resulting in better productivity.
For More Emkay Global Financial Services Ltd Disclaimer http://www.emkayglobal.com/Uploads/disclaimer.pdf & SEBI Registration number is INH000000354