Buy Campus Activewear Ltd for Target Rs 355 by Elara Capital

Steady performance in Q4
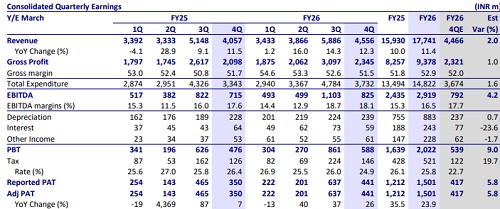
Campus Activewear’s (CAMPUS IN) Q4 performance was as estimated. Revenue grew 12.3% YoY in Q4, led by 10.6% volume growth. Unfavorable product mix in Q4 (higher percentage of school shoes), and persistent input cost inflation in EVA/PU weighed on ASP growth to just 1.5% YoY to INR 668 per pair. The management has indicated that CAMPUS has already taken calibrated price hikes across its portfolio to mitigate raw material inflation. Sneaker volumes crossed 12.7% contribution in Q4. With manufacturing capacity being scaled to 0.8-0.9 mn pairs per month at Pant Nagar, supply constraints are no longer a bottleneck. Notably, management indicated that CAMPUS gained market share in a subdued environment. However, given that near-term margin visibility is clouded by raw material volatility and a step-up in brand investment, we trim our estimates by 4.0%/4.0% for FY27E/28E, and cut our TP to INR 355 (from INR 370), valuing the stock at 55x FY28E P/E. Maintain BUY
Volume-led growth:
Q4 revenue grew 12.3% YoY to INR 4,556mn led by 10.6% volume growth (6.8mn pairs) in Q4FY26. Unfavorable product mix in Q4 (higher percentage of school shoes), and persistent input cost inflation in EVA/PU weighed on ASP growth to just 1.5% YoY to INR 668 per pair. The online channel continued to outperform, up 18.9% YoY in Q4 versus 5.5% for the distributor channel, reflecting stronger marketplace execution across Amazon, Myntra, Flipkart and brand.com. D2C contribution rose to 48.3% in Q4 from 44.8% in Q4FY25. The women’s segment gained momentum, with contribution rising to ~22%. CAMPUS launched ~250 new SKUs in FY26 and unveiled a refreshed brand identity, soft-launched from October 2025. We expect a revenue CAGR of 11.0% in FY26-29E, driven by a volume/ASP CAGR of 7.1%/3.7 in FY26-29E
Expect EBITDA margin to reach 17.3% in FY28E:
Gross margin declined 26bps YoY to 51.5% versus 51.7% in Q4FY25, impacted by raw material inflation, and an unfavorable seasonal mix. EBITDA margin rose 49bps YoY to 18.1%, on the back of operating leverage. EBITDA grew 15.4% YoY to INR 825mn. Management expects to maintain EBITDA margin in the range of 17-19%. Through considering the inflationary environment and investment behind advertisement campaign, we expect EBITDA margin of 16.8% in FY27E and 17.3% in FY28E.
Expanding distribution footprint:
CAMPUS’ distribution channel grew 5.5 % YoY, while the online channel grew 18.9% YoY, led by design innovation. CAMPUS added 1,000+ retailers QoQ to reach a total of 30,000+ retailers. In Q4FY26, its retail network stood at 300+ exclusive brand outlets (EBOs) and 2,300+ counters in large format stores (LFS). Distributor count came down to 260 (280 in Q3FY26) as the company introduced super stockist to deepen penetration
Maintain BUY; TP pared to INR 355:
Expect revenue/EBITDA/PAT CAGRs of 11.0%/13.2%/12.3% in FY26-29E respectively. We are positive on CAMPUS’ long-term activewear growth, led by launches, strong sneaker momentum, and digital-led brand building. However, given that nearterm margin visibility is clouded by raw material volatility and a step-up in brand investment, we trim our estimates by 4.0%/4.0% for FY27E/28E and introduced FY29E. So, we cut our TP to INR 355 (from INR 370), valuing the stock at 55x FY28E P/E (unchanged). Key triggers are easing competitive intensity and widespread revival in demand.
Please refer disclaimer at Report
SEBI Registration number is INH000000933







.jpg)



.jpg)