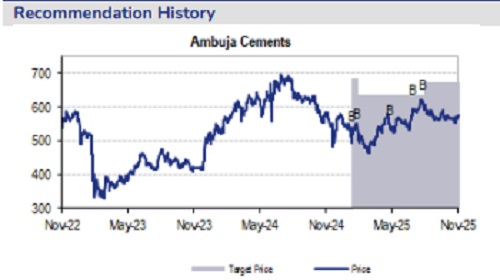
Buy Ambuja Cements Ltd For Target Rs. 700 By JM Financial Services
Ambuja Cements’ consolidated adjusted EBITDA increased 52% YoY/ declined ~14% QoQ to INR 16.9bn (JMFe: INR 16.1bn) in 2Q, a 13% beat on consensus estimates led by lower-thanexpected cost/tn. Blended EBITDA/tn rose 28% YoY/ fell 4% QoQ to INR 1,002 (JMFe: INR 930). The company has guided for further cost reduction of INR 200/tn in 2HFY26 through improved efficiencies and higher operating leverage and expects to maintain four-digit EBITDA/tn, while it has reiterated its EBITDA/tn guidance of 1,450-1,500 by FY28. The company has raised its capacity target to 155mt (vs. earlier 140mt) by FY28 with additional 15mt (clinker backed) expansion to be added through debottlenecking/new plants at a capex of ~USD 48/tn. Factoring in 2Q beat and capacity expansion, we raise our FY26E-27E EBITDA estimates by ~2-5% and broadly maintain them for FY28, and revise our TP to INR 700/sh based on 17x Dec’27E (post quarterly roll-over). We maintain our BUY rating, backed by Ambuja’s strong market positioning, pan-India presence, industry-leading volume growth, and a net cash balance sheet. Within the group, we continue to prefer Ambuja over ACC, given its superior growth outlook.
* Result summary: Ambuja’s consolidated adjusted EBITDA went up 52% YoY/ fell ~14% QoQ to INR 16.9bn in 2Q. Consolidated EBITDA/tn (on clinker and cement volume) increased 28% YoY/ declined 4% QoQ to INR 1,002 (JMFe: INR 930), a decline of INR 42/tn sequentially. Consolidated volume (clinker and cement) rose ~18% YoY/ declined 10% QoQ to 16.9mt; ~3% below our estimates. Blended realisation grew ~6% YoY/ fell 0.7% QoQ to INR 5,418 (vs. JMFe: INR 5,493). In 1HFY26, the company generated negative FCF of ~INR 75bn post w/cap blockage of INR 21.5bn and net capex spend of INR 90.7bn (including INR 59bn payment for Orient Cement acquisition). Net cash declined INR 83bn YoY/ ~INR 12bn QoQ to INR 18.1bn as of Sep'25.
* What we liked: Better profitability led by lower opex/tn; capacity additions at lower capex
* What we did not like: Working capital blockage and decline in cash position
* Earnings Call KTAs: 1) The company reiterates its EBITDA/tn guidance of INR 1,450-1,500 by FY28; it also expects EBITDA/tn for Penna and Sanghi to gradually ramp up and reach four-digit levels. 2) The company targets to reach capacity of 118mt and 130-135mt by FY26 and FY27, respectively, and has upgraded its FY28 target capacity from earlier 140mt to 155mt. This additional 15mt (clinker backed) expansion is to be added through debottlenecking/ new plants at a capex of ~USD 48/tn. 3) It aims to increase its clinker capacity from 73mt to 81mt by FY27 and 96mt (vs. earlier 84mt) by FY28, respectively. 4) The company targets to achieve total cost/tn of INR 4,000 by FY26 (~INR 200/tn reduction in 2H), and further ~5% reduction YoY for the next 2 years, translating to cost/tn of INR 3,800 by FY27 and INR 3,600-3,650/tn by FY28, respectively. This reduction mainly to be driven by ~INR 50/tn in RM cost, ~INR 200/tn in P&F cost, ~INR 100/tn in freight cost and ~INR 50/tn in other overheads. 5) Expansion updates: i) Commenced trial run at 4mt new kiln line at Bhatapara; ii) Commenced operations at 2mt Krishnapatnam GU, taking its total capacity to 4mt; iii) Targets to commission 2.4mt Salai Banwa, 2.4mt Marwar, 1.2mt Dahej and 1mt Kalamboli in 3QFY26 and remaining 5.6mt by 4QFY26; 6) Plants of Orient, Penna and Sanghi have moved ~100% into Adani Cement, which led to a higher sales promotion cost of INR 30/tn in 2Q, while maintenance cost for these assets stood at INR 42/tn. 7) Guided capex of ~INR 80bn p.a. 8) On the RMX front, it expects the segment to consume ~5% of cement by FY28 vs. current 2%.
Please refer disclaimer at https://www.jmfl.com/disclaimer
SEBI Registration Number is INM000010361