Bulls and Bears : The market ends in the green; FIIs record outflows for the fourth consecutive month by Motilal Oswal Financial Services Ltd
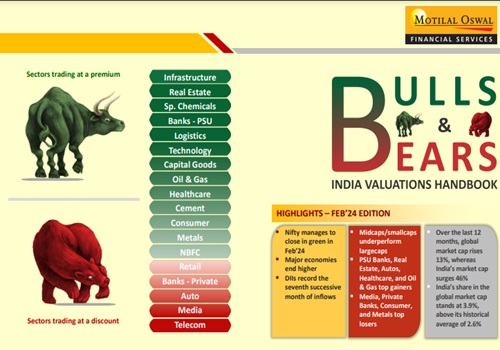
The market ends in the green; FIIs record outflows for the fourth consecutive month
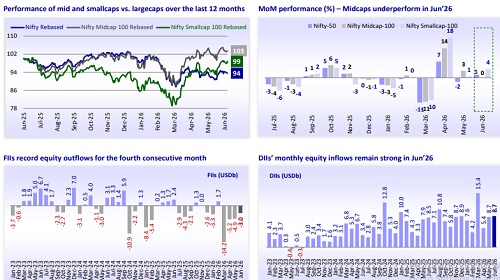
* Nifty rebounds and closes in the green for Jun’26: The Nifty, after consolidating in May’26, managed to close in the green (+1.4% MoM to 23,866 in Jun’26). Notably, the index was extremely volatile, swinging around 1,191 points before closing 318 points higher. The Nifty is down 8.7% in CY26YTD. Over the last 12 months, largecaps have been down 6%, underperforming midcaps (+3% YoY) and smallcaps (-1% YoY). Over the last five years, midcaps (CAGR: 18%) have notably outperformed largecaps (CAGR: 8.7%) by 77%, while smallcaps (CAGR: 14.1%) have markedly outperformed largecaps by 42%.
* DII inflows remain strong; FIIs record outflows for the fourth consecutive month: DII inflows were strong at USD8.7b in Jun’26, while FIIs recorded outflows for the fourth consecutive month in Jun’26 at USD3b. Notably, FII outflows into Indian equities stand at USD29b, while DII inflows into equities continue to be strong at USD50.1b in CY26YTD.
* Breadth balanced in Jun’26: Sector wise, Private Banks (+6%), Real Estate (+6%), Media (+5%), PSU Banks (+4%), and Healthcare (+4%) were the top gainers MoM, while Technology (-10%), Metals (-7%), Power (-3%), Oil & Gas (-3%), and Consumer (-1%) were the only laggards. The breadth was balanced in Jun’26, with 24 Nifty stocks closing higher. Interglobe (+22%), Max Health (+17%), Trent (+17%), Bajaj Finance (+11%), and Shriram Finance (+10%) were the top gainers, while Wipro (-17%), Hindalco (-15%), Infosys (-14%), ONGC (-11%), and Tata Motors PV (-11%) were the key laggards.
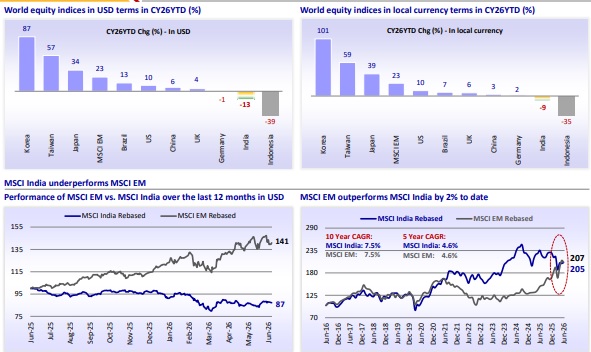
* India among the positive performers in Jun’26: Among the key global markets, Japan (+6%), Taiwan (+3%), India (+1%), the UK (+1%), and China (+1%) ended higher MoM. However, Indonesia (-8%), MSCI EM (-2%), the US (-1%), Brazil (-1%), and Germany (-0.4%) ended lower MoM in Jun’26. During the past 12 months, the MSCI India Index (-13%) has underperformed the MSCI EM Index (+41%) in USD terms. The MSCI EM Index has outperformed the MSCI India Index by 2% to date.
* Earnings – Corporate profit-to-GDP reaches unprecedented heights! In 2026, the corporate profit-to-GDP ratio for the Nifty-500 universe surged to 5.2%, marking an all-time high. Notably, for the listed India Inc., the ratio stood at 5.7%, at an 18-year high. The YoY increase in the profit-to-GDP ratio for the Nifty-500 was influenced by Automobiles, Oil & Gas, Metals, NBFC Lending, Capital Goods, Insurance, et al. In contrast, sectors that experienced a decline in the ratio included Private Banks, Consumer, Telecom, Healthcare, and Infrastructure (Detailed report).
* Valuation for the Nifty-50 below its historical average: The Nifty is trading at a 12-month forward P/E ratio of 18.8x, below its LPA of 21x (at a 10% discount). Further, its P/B of 2.7x represents a 5% discount to its historical average of 2.9x. The 12-month trailing P/E for the Nifty, at 21.6x, is below its LPA of 23.2x (at a 7% discount). At 3x, the 12-month trailing P/B ratio for the Nifty is below its historical average of 3.2x (at a 4% discount). Notably, two-thirds of the sectors trade at a discount to their averages. Capital Goods, PSU Banks, Metals, Oil & Gas, Healthcare, and Utilities trade at a premium to their longperiod average (LPA) valuations, while Private Banks, Consumer, Technology, and Retail trade at a discount to their LPA.
* View: Indian markets have been lackluster over the past six months (Nifty -8.7% CY26YTD) and underperformed several global peers. This is primarily attributed to record FII outflows and earnings concerns, compounded further by a series of geopolitical and macro headwinds. While earlier fears of a severe oil shock and the Middle East crisis have somewhat subsided, a favorable base has likely been set for Indian equities. India's GDP growth accelerated to 7.7% YoY in FY26, exceeding our expectations (7.5% YoY) and improving from 7.1% in FY25. The Services segment was the primary growth engine, delivering strong performance across trade, financial services, real estate, IT, and professional services. Our model portfolio broadly reflects our preference for growth visibility, structural domestic growth plays, and select global value names. We firmly believe that this is a bottom-up market, despite India witnessing both time and price corrections relative to EM peers. Our key OW sectors are Autos, PSU Banks, Diversified Financials, Manufacturing & Industrials, Consumer Discretionary, and New-age platforms. In contrast, we are UW on Oil & Gas, Private Banks, Metals, Consumer Staples, IT, and Commodities/Utilities.
* Top Nifty-50 Ideas: Bharti Airtel, SBI, ICICI Bank, M&M, Titan, Eternal, Shriram Finance, and Interglobe Aviation. Top Non-Nifty-50 Ideas: TVS Motors, Radico Khaitan, ICICI Pru AMC, Groww, Indian Hotels, AU Small Finance, Dixon Tech, Coforge, Cummins, and Delhivery.
Midcaps underperform; smallcaps outperform largecaps
India continues to lag global peers in CY26YTD
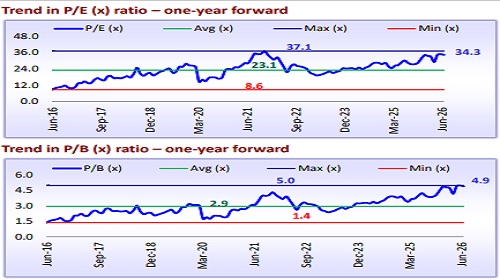
NBFC Non-lending: Mixed valuation trajectory amid volatile performance
* Non-lending NBFCs are currently trading at a P/E multiple of 34.3x, which is significantly above their long-term average of 23.1x. We believe valuations remain attractive in a few stocks despite an uptick over the past few months, backed by gradually growing activity across asset classes. However, a degree of regulatory overhang persists, which may result in price corrections.
* Brokers such as Angel One have experienced an uptick and are currently trading at a P/E ratio of ~21.0x, which is above the average of 15.9x. This increase has been driven by rising retail activity during the recent months of market volatility, with further potential for growth once positive sentiment prevails. Exchanges have remained volatile, with BSE now trading at 38.9x, under the overhang of the impact uncertainty of RBI tightening on proprietary traders. Meanwhile, MCX is trading at 44.2x, which is broadly in line with the average, although its key growth drivers remain contingent upon further improvement in market participation amid rising competition from NSE’s commodity exchange.
* AMCs have seen a mixed trajectory with respect to the P/E multiple, with fund performance declining slightly but flow momentum remaining consistent. Among the players, NAM has emerged as the strongest performer, trading at a peak P/E of 40.0x, driven by robust demand from passive funds, followed by ABSLAMC at a new peak of 29.6x, driven by improving fund performance. In contrast, HDFCAMC is currently trading at a relatively attractive valuation of 33.3x, which is primarily in line with its average P/E.
* Valuations of depositories have corrected sharply due to a slowdown in IPO activity and a volatile cash market, though they still remain elevated. MF RTAs have seen some degree of correction owing to yield compression. CAMS is trading at a valuation of 40.5x, which is below its average, while KFin has corrected from a premium to a valuation similar to that of CAMS. * Wealth managers have experienced volatility in P/E multiples, primarily due to rising cost pressures, supply-side challenges, and negative market movements, while flow momentum has been stable. Within the sector, 360 ONE continues to trade at an above-average P/E, whereas Nuvama has seen a strong uptick and is trading at an above-average valuation of 25.9x but remains attractive given that the impact of Jane Street is now behind us.
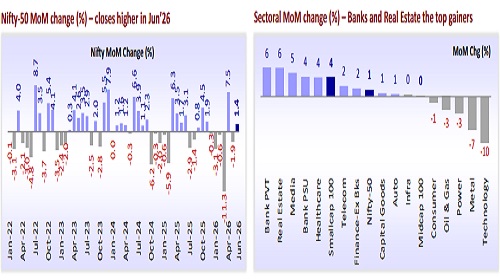
Nifty ends in the green and adds 318 points (+1.4% MoM) in Jun’26
* The Nifty, after consolidating in May’26, managed to close in the green (+1.4% MoM to 23,866) in Jun’26. Notably, the index was extremely volatile, swinging around 1,191 points before closing 318 points higher. The Nifty is down 8.7% in CY26YTD.
* Sector wise, Private Banks (+6%), Real Estate (+6%), Media (+5%), PSU Banks (+4%), and Healthcare (+4%) were the top gainers MoM, while Technology (-10%), Metals (-7%), Power (-3%), Oil & Gas (-3%), and Consumer (-1%) were the only laggards.
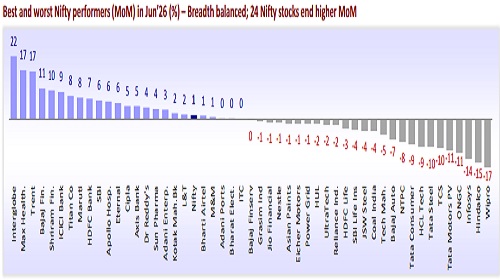
Breadth balanced in Jun’26, with 24 Nifty stocks closing higher MoM
* Best and worst Nifty performers in Jun’26: Interglobe (+22%), Max Healthcare (+17%), Trent (+17%), Bajaj Finance (+11%), and Shriram Finance (+10%) were the top gainers, while Wipro (-17%), Hindalco (-15%), Infosys (-14%), ONGC (-11%), and Tata Motors PV (-11%) were the key laggards.
* Best and worst Nifty performers in CY26YTD: Adani Enterp (+36%), Apollo Hospitals (+23%), Adani Ports (+23%), Trent (+15%), and Coal India (+10%) have been the top performers, while Infosys (-38%), TCS (-37%), Wipro (-35%), HCL Tech (-34%), and ITC (-29%) have been the key laggards.
For More Research Reports : Click Here
For More Motilal Oswal Securities Ltd Disclaimer
http://www.motilaloswal.com/MOSLdisclaimer/disclaimer.html
SEBI Registration number is INH000000412