Bank Nifty rebounds from 50% retracement after early decline - ICICI Direct

Nifty :25710
Technical Outlook
Day that was…
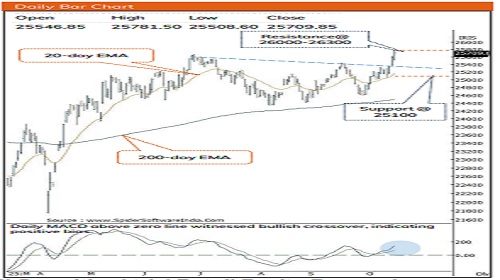
Equity benchmarks extended gains and closed at 4 months high at 25710, up 1.7%. Sectorally, Financials, FMCG, realty outshone. The weekly price action formed a sizable bull candle forming higher high-low despite volatile global cues, indicating inherent strength
Technical Outlook:
* Index poised for a strong gap-up opening, fueled by upbeat Q2 results from index heavyweights and positive global cues, indicating a bullish start to the session.
* The series of higher high-low formation helped index to log a resolute breakout from one year falling trend line, indicating conclusion of corrective bias that has opened the door for next leg of up move towards All-Time high of 26300 for the coming months. Hence, any decline from hereon amid global volatility coupled with ongoing earning season should be capitalized to accumulate quality stocks with strong earnings as strong support is placed at 25200 being 50% retracement of current leg of up move (24587-25782)
Our positive bias is further validated by following observations:
* Following the Auto and Metal sector the Bank Nifty has now clocked a fresh All Time High, indicating renewed strength that would provide impetus for Nifty to head towards 26300 in coming month as Bank Nifty carries 36% weightage in Nifty
* In the upcoming truncated week market will react to key index heavy weight earnings carrying 35% of Index weightage which would dictate the further course of action
* The current up move is backed by the improvement in market breadth as currently the ratio chart of stocks hitting new 52 weeks high vs new 52 weeks low (Nifty 500 Universe) continues to inch upward, highlighting strengthening of rally.
* Nifty has been maintaining the rhythm of witnessing rally after approaching maturity of price and time wise correction. As Nifty has rallied 18% off April low, within which intermediate corrections arrested within 3-5% range. Meanwhile, timewise, over past three decades, there have been 12 instances wherein index has staged a strong rebound after consecutive 8 sessions negative close, garnering 7% rolling return in a month. In current scenario, index has rallied ~5%
Key Monitorable for the next week:
a. Development on tariff negotiations.
b. Gold: With > 60% up move in this year the monthly RSI has surpassed 90 levels for the first time since 1980. Such overbought conditions suggest possibility of short-term breather wherein Gold can consolidate in $4400-$3900 range
c. Cool off in the US 10 Year Yield augurs well for inflows in emerging markets
d. Crude Oil: The formation of lower high-low on the weekly chart clearly indicates weakness that bodes well for domestic market
Intraday Rational:
* Trend- Higher high-low formation confirms positive momentum
* Levels: Around Fridays close( 25760-25805)
Nifty Bank : 57713
Technical Outlook
Week that was:
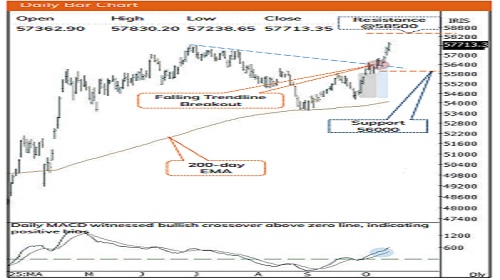
Bank Nifty extended it gains for the third-consecutive week and settled at 57,713 up 1.95%. The Nifty Private Bank index has mirrored the benchmark, ending the week at 28,239 up 1.72%
Technical Outlook:
* Bank Nifty started the week on a flat note, however, after an initial decline, buying demand emerged near the 50% retracement level of the previous week’s rally. As a result, the weekly price action formed a bullish engulfing candle with a higher high-low structure, indicating resurgence of bullish momentum.
* Key point to highlight is that, the recent rally has propelled the index to surpass its previous all-time high, confirming a bullish breakout and opening room for incremental gains. Key retracement levels from downswing between 57,628 (previous high) and 53,561 (previous low) show that the index has decisively reclaimed all major retracement zones. Going ahead, a sustaining stability above this levels would signal a resumption of the primary uptrend, paving the way for an extended move towards 58,500, being 123% implied target of the previous decline (57,630-53,561). Therefore, any dip from current levels should be seen as a buying opportunity, with immediate support placed near 56,000 representing the 50% retracement of the ongoing up move (54,226- 57,830).
* Structurally, over the past two decades, there have been 17 instances where Bank Nifty, following a decisive breakout above its previous twomonth high, has delivered double-digit returns within the subsequent four months while surpassing its prior all-time high. In the current scenario, with the index decisively breaking out above its previous two-month high, a similar structural rhythm appears to be unfolding, indicating a high probability of achieving double-digit returns and surpassing the all-time high of 57,600 in the coming months.
* PSU Bank Index has relatively underperformed the benchmark and closed on a negative note. Following the breakout from the inverse head and shoulder pattern, the index has maintained its upward trajectory, trading in close proximity to the rising trendline, thereby reaffirming higher-highlow formation as per Dow Theory, indicating sustained bullish undertone. Therefore, any dip from current levels should be seen as a buying opportunity, with immediate support placed near 7,242, which aligns with the 50% retracement of the latest upswing (6,730–7,774)
Intraday Rational:
* Trend- Higher high-low formation confirms positive momentum
* Levels: Around Fridays close( 57760-57822)
Please refer disclaimer at https://secure.icicidirect.com/Content/StaticData/Disclaimer.html
SEBI Registration number INZ000183631


More News

The banking index continued to surge higher for the third consecutive session - Religare Bro...
.jpg)