Bank Nifty opened the week on a subdued note and oscillated around 20-day EMA throughout the week - ICICI Direct

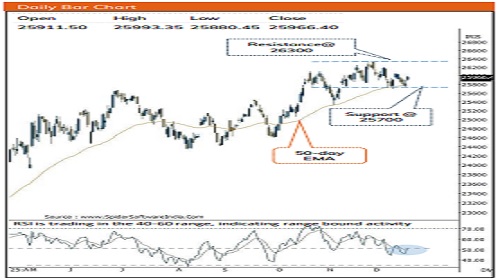
Nifty :25966
Technical Outlook
Week that was…
Equity benchmark extended losses over third consecutive week tracking muted global cues. Nifty settle the week at 25966, down 80 points or 0.3%. as deprecating rupee weighed on the market sentiment. Broader market relatively outperformed and settled on a flat note. Sectorally, IT, FMCG, PSU Bank remained in limelight while financials took a breather.
Technical Outlook:.
* The weekly price action formed an inside bar, indicating slowing down of downwards momentum.
* Despite the elevated volatility, the index continues to hold firmly Key point to highlight is that, past three week’s corrective phase has been captured in a well-defined downward sloping channel. Friday’s sharp rebound has brought the index closer to upper band of downward slanting channel. The resolute breakout from falling channel (at 26050) would confirm resumption of uptrend, Paving the way to challenge All Time High around 26300 and eventually open the door for next leg of up move towards 26700 in the coming month.
* Despite elevated volatility, on multiple occasions Nifty managed to hold 50 days EMA coincided with last week’s low of 25700 that makes us retain support base at 25700 for upcoming week
Our constructive bias is outlined on the basis of following observations:
* a)Structurally, the index has been undergoing a slower pace of retracement. With past three weeks correction it has retraced merely 61.8% of preceding three week’s rally. Amid this corrective phase index has respected 50 days EMA which has been held over past two months, underscoring the market’s inherent strength.
* b)The BankNifty has been trading around its 20 days EMA despite ongoing global volatility. Meanwhile, pullback in IT and Oil & Gas signifies revival in upward momentum. Together these three sectors account for >55% of Nifty’s weightage
* c)Santa rally on cards: Historical data since 1995 suggest that, on 90% of the occasions Nifty has delivered positive returns in last 10 days of the year with a median of 2%
* d)USD/INR: Price action since February 2016, has been confined in a rising wedge and has historically exhibited a strong inverse correlation with the Nifty. Historically, there have been five instances where a retreat in USD/INR from the upper band of this wedge averaging a ~4% decline (with a maximum drawdown of ~7%) over a two-month period was followed by the Nifty delivering average gains of >10% over the subsequent two months.
* Last week, USD/INR once again retreated from the upper end of its long-term rising wedge. The setup closely mirrors these past inflection points, suggesting the potential for a similar cyclical rhythm to unfold in coming weeks
Key Monitorable for the next week:
* US and India Tarde Deal: The favourable outcome of US and India trade deal could accelerate the positive momentum in the market and pave the way for return of FII’s in the Indian markets.
* US GDP data
* Brent Crude Oil: dropped ~2% during the week and surpassed it previous swing low. Further cool off in Brent crude oil bodes well for domestic market
* he potential for a similar cyclical rhythm to unfold
Intraday Rational:
* Trend- Buying demand from50 days EMA signifies inherent strength
* Levels: After a gap up opening, dip towards previous sessions close should be used as buying opportunity in the range of 25980-26015
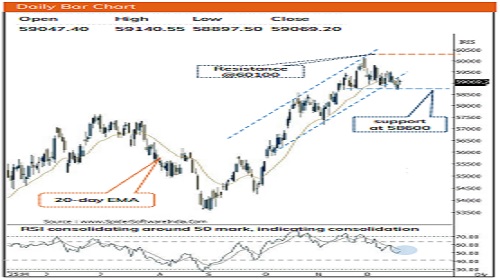
Nifty Bank : 59069
Technical Outlook
Week that was:
Bank Nifty extended its corrective mode for second consecutive week in a row ending at 59069, down 0.5% weekly basis. The Nifty PSU Bank Index relatively outperformed the benchmark gaining 1.3% on weekly basis.
Technical Outlook:
* Bank Nifty opened the week on a subdued note and oscillated around 20-day EMA throughout the week. The weekly price action formed a High wave candle with shadow on either side indicating extended breather amid elevated volatility.
* Index has been consolidating in 1400 points range over past four weeks. Therefore, holding lower band of consolidation 60100- 58600 would keep pullback option open towards upper band of consolidation at 60100. Over the past 14 weeks, Bank Nifty has surged ~12%, clearly outperforming the 7.5% gain in the Nifty50 and reinforcing the sector’s strengthening leadership within the broader market
* Momentum oscillators continue to reflect a bullish bias, while short and medium-term moving averages remain in a steady upward slope, validating the ongoing positive trend. Any temporary pullback should be treated as a buying opportunity in high-quality banking names, particularly those that delivered solid Q2 earnings, as immediate support is placed near 58,600, corresponding with the 50% retracement of the current advance (57,157–60,114).
* The PSU Bank Index has maintained its higher high higher low formation on daily chart while consolidating above 50-day EMA. The stochastic indicators is in rising trajectory suggesting uptrend intact. Nevertheless, pullbacks should be viewed as accumulation opportunities, with strong support around 8,100, aligning with the 38.2% retracement of the 6,730–8,665 rally and the 50-day EMA
Intraday Rational:
* Trend- Buying demand from 20 days EMA signifies inherent strength
* Levels- After a gap up opening, dip towards previous sessions close should be used as buying opportunity in the range of 59240- 59300
Please refer disclaimer at https://secure.icicidirect.com/Content/StaticData/Disclaimer.html
SEBI Registration number INZ000183631


More News

Nifty 50 closed at 24,596, rebounding from the falling channel`s lower trendline - Religare ...