Thinking Allowed : How are Indian Equity Valuations currently By Axis Mutual Fund

Follow us Now on Telegram ! Get daily 10 - 12 important updates on Business, Finance and Investment. Join our Telegram Channel
Background
The decision to buy or sell a stock depends on various indicators (qualitative as well as quantitative) related to the macroeconomic conditions as well as company specific fundamentals which involve analyzing the Profit & Loss statement (P&L) and Balance Sheet. Quantitative analysis of a particular company helps in identifying the intrinsic value (fair value) of the company against the price which it is trading at. Valuation measures provide a guide about the value of a company which can help in making an informed investing decision.
Broadly speaking there are two types of valuation metrics; relative and absolute. Relative valuation ratios allow investors to compare a particular stock to their sector / broader market. Relative ratios can help in gauging the attractiveness of a stock w.r.t the sector / industry that it operates in. While there is a broad gamut of valuation ratios, the most commonly used ones are P/E (Price to Earnings) and P/B (Price to Book).
PE ratio:
Price to earnings ratio is arrived at by dividing the share price of a company by the company’s earnings per share. A PE ratio gives an investor an insight about how much an investor is willing to pay per share for every 1 rupee of earnings. A P/E ratio is a guide (absolute reading) and not a solution to determining whether the stock is overvalued or undervalued. This is because the relative valuation of the sector that the company operates in also needs to be considered before arriving at that decision. Also the ratio needs to be read in tandem with other valuation ratios in order to arrive at a more concrete analysis of a stock / market index.
Using this basic ratio can go a long way in assessing the long term trend of the market. However, these multiples provide a snapshot of the status of the company, not the potential.
The Current market scenario:
Since the beginning of the year, Indian equity markets have corrected on account of an elongated geopolitical conflict between Russia and Ukraine and the consequent rise in key commodity prices. That apart, central banks’ action to tame galloping inflation by raising key rates also punctured the equity market rally.
Indian benchmark indices have corrected 14-15% from all-time highs and consequently, Indian valuation which can be indicated by broader market index Nifty 50, the trailing PE is at 20.2x now. It is currently trading at about 21.5 times FY23 earnings. Indian valuation has always been on a premium over emerging markets, which usually ranges from 15 percent to 90 percent. India's valuation (MSCI India) premium for the MSCI EM Index is over 40% which is in the below average level. Although there are macro-economic issues, India's long-term outlook is good due to its demography and strong growth attributes. But this year relatively high valuations limit the potential for upsides and increase the risk of an annual economic slowdown, especially given the rising interest rate environment with the increasing risk of an economic slowdown in the US that may adversely impact global equities as an asset class.
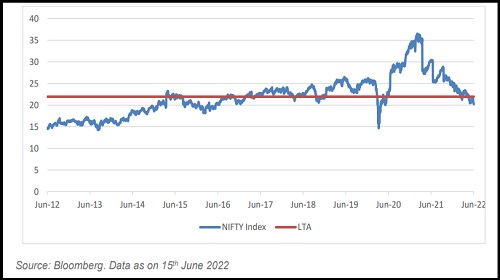
Another risk that India is facing along with other global economies is the geopolitical and oil related uncertainty as it can depress economic growth due to India’s high dependency on imports of crude and metals. The current PE is reasonably lower than its long term average(LTA) value of 21.9x. Although the current PE is expensive than other emerging markets, it is at a discount to LTA which gives investors an opportunity for long term investment.
PE ratio of NIFTY 50 compared to the long term average (10-year)
What’s the short term view given by these metrics?
History can be a good guide for us to understand how the market behaves during different PE ranges. We have conducted an exercise by analyzing the past 15 year valuations of Nifty 50 to help us understand this. The outcome is promising and it is clear that when valuations are in a defined bucket there is a direct correlation with the returns that an investor makes over the next 2-3 years.
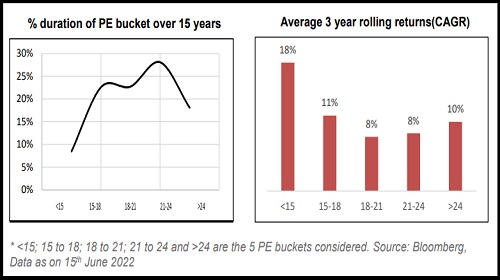
The chart on the left tells us the time period for which a particular PE band has existed over the last 15 years. For instance, a PE band >24 has existed 18% of the time. If we combine it with the chart on the right, it gives us an indication of what the average 3 year rolling returns in this PE band has been. So taking the above example, we can see that whenever markets (Nifty 50) has been in a PE band >24, the average 3 year rolling return for the past 15 years has been 10%.
Conclusion
India's current valuations (post the recent correction) presents a decent entry point to taking exposure to Indian equities from a long term point of view. There is a myth that entering at higher valuation multiples leads to poor stock market performance. But as seen above, even at the highest valuation point investors can expect decent returns provided they stay invested for a minimum of 3 years.
To Read Complete Report & Disclaimer Click Here
Above views are of the author and not of the website kindly read disclaimer