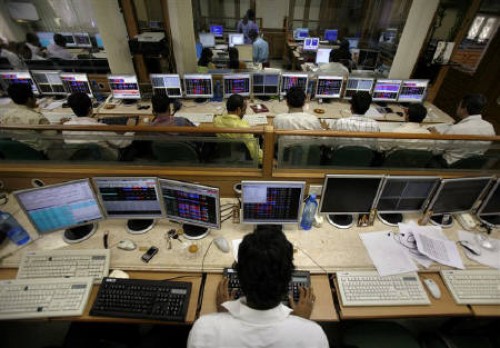
The index started the session on a positive note and continued with its northbound journey throughout the session - ICICI Direct

Follow us Now on Telegram ! Get daily 10 - 12 important updates on Business, Finance and Investment. Join our Telegram Channel
Nifty : 17401
Technical Outlook
* The index started the session on a positive note and continued with its northbound journey throughout the session as intraday dips were bought into. The daily price action formed a sizable bull candle carrying higher high-low, indicating rejuvenation of upward momentum as index closed above Friday’s long bear candle.
* Key point to highlight is that, once again buying demand emerged after 10% correction. Thereby, maintaining the rhythm of not correcting for more than 9-10% since May 2020, indicating structural bull trend is intact. Going ahead, we expect index to resolve higher and head towards 17600 as it is confluence of 50 days EMA coincided with 50% retracement of current decline (18210-16782)
* A decisive close above past four sessions high signifies pause in downward momentum and augurs well for further pullback. Thus, dips should be capitalised on to accumulate quality stocks as we do not expect Nifty to breach key support threshold of 16900-16700 based on following observations seen in past 20 months:
* a) Since May 2020, in all three corrections index retraced 38% of preceding rally. 38% retracement of current rally is placed at 16900
* b) since May 2020, the index has not corrected for more than 10%. In current scenario, 10% correction from lifetime high of 18600 will mature at 16740
* The broader market indices are forming a higher base above 100 days EMA which has been held since June 2020, highlighting robust price structure. We believe, ongoing consolidation will make market healthy. Therefore, focus should be on accumulating quality stocks to ride structural uptrend.
In the coming session, the index is likely to open on a muted note tracking mixed Asian cues. We expect index to trade with a positive bias while maintaining higher high-low formation. Hence, use dip towards 17332-17355 for creating long position for target of 17443
NSE Nifty Weekly Candlestick Chart

Nifty Bank: 36508
Technical Outlook
* The daily price action formed a bull candle with a higher high -low which remained contained inside Tuesday’s 1200 points price range signaling continuation of the consolidation while holding above the 200 days EMA (placed at 35333 ) . Index need to form higher high -low on a sustained basis in the daily chart for reversal of the corrective trend
* We expect the index to hold above the support area of 200 days EMA (placed at 35333 ) and continue with its last four sessions consolidation in the broad range of 35300 -37100 in the coming sessions
* Key observation is that the index since April 2020 in major corrective phase has taken 6 - 7 weeks, with five weeks of correction already behind us we expect the index to form a base in the coming couple of weeks
* On the higher side last Friday’s gap down area of 37100 which also confluence with the 38 . 2 % retracement of the November decline (40160 -35328 ) is likely to act as immediate hurdle for the index
* Nifty Bank has immediate support at 35300 levels being the confluence of the 200 days EMA and the 80 % retracement of the August -October 2021 rally (34115 -41829 )
* Among the oscillators the daily stochastic is seen rebounding from the oversold territory with a reading of 41 signaling continuation of the last two sessions pullback
* In the coming session, index is likely to open on a soft note amid mixed Asian cues . Volatility is likely to remain high on account of the volatile global cues as the index forms a base around the 200 days EMA . Hence use intraday dips towards 36290 -36370 for creating long position for the target of 36630 , maintain a stoploss at 36180.
Nifty Bank Index – Daily Candlestick Chart

To Read Complete Report & Disclaimer Click Here
https://secure.icicidirect.com/Content/StaticData/Disclaimer.html
Views express by all participants are for information & academic purpose only. Kindly read disclaimer before referring below views. Click Here For Disclaimer


Tag News

Stock Picks : TCS Ltd And Chambal Fertiliser Ltd By ICICI Direct


More News

Sold Index Option worth 34433 Cr - Axis Securities Ltd