


The index managed to hold the key support threshold of 14200 - ICICI Direct

Follow us Now on Telegram ! Get daily 10 - 12 important updates on Business, Finance and Investment. Join our Telegram Channel
Index correction approached price wise, time wise maturity…
Technical Outlook
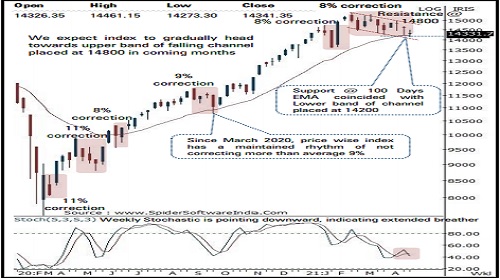
* Despite anxiety around surging Covid-19 cases across India, the index managed to hold the key support threshold of 14200 on multiple occasions over past six weeks as the elevated buying demand emerged in the vicinity of 100 days EMA placed at 14170. As a result, weekly price action index formed a high wave candle, indicating elevated volatility at key support base of 14200
* Going ahead, we expect index to resolve higher and gradually head towards upper band of falling channel placed at 14800 in coming months. Our constructive thesis on the market is based on:
a) Since Mar-20, Nifty, Bank Nifty has a maintained rhythm of not correcting more than 9% and 20% respectively. With both indices approaching price wise maturity of correction, we expect Bank Nifty to drive Nifty higher as financials carry 38% weightage in Nifty
b) Past two months corrective phase has been captured in a well define falling channel. Over past 2 weeks, index has been forming a base at lower band of falling channel. We expect index to resolve higher and head towards upper band of channel placed at 14800
* Sectorally, we prefer BFSI, IT and consumption sectors to participate in pullback given their favourable risk-reward setups
* On the stock front, within large caps, we like TCS, Axis Bank, HDFC, Bajaj Finserv, Tata Steel while Astral Poly, Polycab, Graphite, Jindal steel& Power, Thermax, Sequent Scientific, Indoco Remedies , SBI Life , InfoEdge, are expected to outperform in midcap space
The broader market indices have shown resilience by forming a higher base above 50 days EMA, which has been held since June 2020. Key point to highlight is that, the Nifty midcap and small cap indices have maintained the rhythm of not correcting for more than average 10%, since March 2020, indicating robust price structure. Currently, both indices have corrected 8% from their 52 weeks high. We expect, both indices to maintain the rhythm and gradually accelerate its relative outperformance against benchmark. Structurally, key support is placed at 14200. Only the breach below 14200 would lead to extended correction towards key support of 13900-13800 range, as it is confluence of:
* a) 80% retracement of the February rally (13596-15432), at 13963
* b) 10% correction from life highs (15432) measures around 13900
In the coming session, index is likely to witness gap up opening, indicating positive bias. Hence, use intraday dip towards 14355-14380 to create ong for target of 14469
NSE Nifty Weekly Candlestick Chart
Nifty Bank: 31722
Technical Outlook
* The weekly price action formed a bull candle with shadows in either direction highlighting intraweek volatility . Index despite Monday’s gap down opening managed to hold near the last week low (30500 ) and gradually recovered its entire intraweek decline to close marginally lower highlighting buying demand at lower levels amid oversold placement of the weekly stochastic
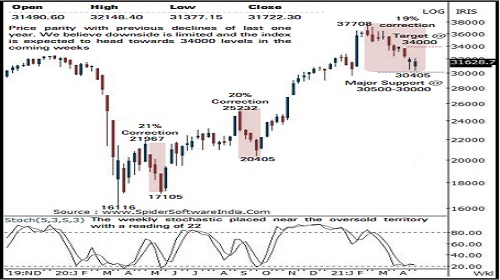
* Going ahead, we reiterate our view that the downsides is limited in Banking index and we expect it to eventually head towards 34000 levels in the coming weeks as it is the confluence of the 50 % retracement of the entire decline (37708 -30405 ) and measuring implication of the last two weeks consolidation range (32325 - 30405 ) . Hence, one should accumulate quality banking stocks in the range of 30500 -31200 to ride next expected up move
* Key point to highlight is since March 2020 bottom, the index has maintained rhythm of not correcting for more than 20 % . In the current scenario, the index is seen forming higher base after correcting 19 % from the all -time high (37708 ) . Bank Nifty in the last two weeks has rebounded three times after testing the support area of 30500 . Hence the index is poised at crucial support and provides favourable risk -reward setup
* The index has strong support in the range of 30500 -30000 levels being the confluence of the following technical observations :
a) Price equality with the average of the previous two major correction in the last one year signals strong support around 30000 levels
b)The rising long term 200 days EMA is also placed around 29870
* The last 10 weeks corrective decline has lead to the weekly stochastic placed near the oversold territory with a reading of 22 indicating an impending pullback in the coming weeks
* In the coming session, the index is expected to open on a positive note on the back of firm global cues . We expect the index to continue with its last two session pullback . Hence, use dips towards 31710 -31770 for creating long position for the target of 31990 , maintain a stoploss of 31590
Nifty Bank Index – Weekly Candlestick Chart
To Read Complete Report & Disclaimer Click Here
https://secure.icicidirect.com/Content/StaticData/Disclaimer.html
Views express by all participants are for information & academic purpose only. Kindly read disclaimer before referring below views. Click Here For Disclaimer


Tag News

Stock Picks : TCS Ltd And Chambal Fertiliser Ltd By ICICI Direct


More News
Post market comment by Mandar Bhojane, Research Analyst, Choice Broking


