The index concluded the volatile session on a flat note as the Nifty oscillated in a 100-point range throughout the day - ICICI Direct

Follow us Now on Telegram ! Get daily 10 - 12 important updates on Business, Finance and Investment. Join our Telegram Channel
Nifty: 17465
Technical Outlook
• The index concluded the volatile session on a flat note as the Nifty oscillated in a 100-point range throughout the day. As a result, the daily price action formed a small bear candle carrying higher high-low, indicating a breather after the past three session’s swift up move
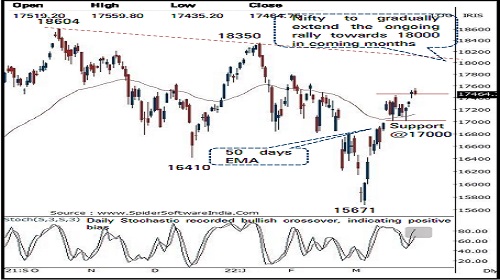
• Going ahead, we expect the Nifty to trade with a positive bias and gradually head towards 18100 in April. However, the move towards 18100 would be in a non linear manner. Hence, post 12% rally from March low of 15671, a temporary breather should not be construed as negative instead dips should be capitalised on as incremental buying opportunity
• Historically we have observed that oversold reading of sentiment indicator (percentage of stocks below 200-DMA) leads to decent up move subsequent months. In the current scenario, sentiment indicator has bounced from oversold territory with a reading of 42%, indicating extension of up move going ahead. Our target of 18100 is based on following observations:
• a) 80% retracement of entire corrective phase since October 2021 (18604-15671)
• b) downward slanting trend line drawn adjoining OctoberJanuary highs (18604-18350)
• Structurally, despite elevated crude prices and hawkish Fed stance, index managed to form strong base around 17000 mark coincided with 50 days EMA, highlighting inherent strength. The breakout from consolidation confirms higher base that makes us confident to revise support base at 17000 as it is 50% retracement of recent up move (16470-17522), placed at 16695 coincided with 50 days EMA
• The broader market indices relatively outperformed after resolving out of higher base above 52 weeks EMA. We expect, Nifty midcap and small cap indices to continue catch up activity with its large cap peers in coming weeks. Thus, focus should be on accumulating quality midcap stocks In the coming session, index is likely to open on a subdued note tracking muted global cues. Post initial blip we expect buying demand to emerge from intraday support of 17400. Hence, use intraday dips towards 17388-17412 for creating long position for target of 17504
NSE Nifty Daily Candlestick Chart

Nifty Bank: 36373
Technical Outlook
• The daily price action formed a high wave candle with a higher high -low signaling consolidation with positive bias for the fourth consecutive session . • On the smaller time frame the index has already taken nine sessions to retrace just 38 . 2 % of the preceding eight sessions up move (32156 -36612 ) . A slower retracement signals a higher base formation
• Going ahead, we expect the index to maintain positive bias and resolve above last two weeks highs placed around 36800 levels and gradually head towards 38000 levels in the month of April 2022 being the 80 % retracement of the February -March decline (39424 -32155 )
• In the process any temporary breather should not be seen as negative, instead should be capitalized as buying opportunity in quality banking stocks
• The immediate support base for the index is placed around 35000 levels being the confluence of :
• (a) 38 . 2 % retracement of the recent up move (32155 - 36612 ) placed at 34900 levels
• (b) The lows of the last two weeks are also placed around 35000 levels
• Among the oscillators the daily stochastic remain in up trend currently placed at a reading of 70 thus supports the overall positive bias in the index In the coming session, index is likely to open muted note tracking subdued global cues . We expect supportive efforts to emerge from psychological mark of 36000 . Hence use intraday dips towards 36140 -36220 for creating long position for target of 36480 , maintain a stop loss at 36020
Nifty Bank Index – Daily Candlestick Chart

To Read Complete Report & Disclaimer Click Here
https://secure.icicidirect.com/Content/StaticData/Disclaimer.html
Views express by all participants are for information & academic purpose only. Kindly read disclaimer before referring below views. Click Here For Disclaimer


Tag News

Stock Picks : TCS Ltd And Chambal Fertiliser Ltd By ICICI Direct


 320-x-100_uti_gold.jpg" alt="Advertisement">


