The index at 14875-14900 and 15050 which are resistances on short term charts - Angel Broking

Follow us Now on Telegram ! Get daily 10 - 12 important updates on Business, Finance and Investment. Join our Telegram Channel
Sensex (50137) / Nifty (14845)
Post the extended weekend, our markets started the session on an optimistic note with a gap up above 14600 mark. The momentum continued throughout the day supported by participation from index heavyweights and Nifty ended the session around 14850, with gains of over a couple of percent
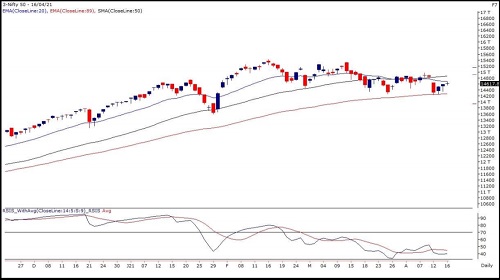
The global markets traded with a positive bias which had a positive impact on our markets at opening. We then witnessed a good buying interest in the benchmark and some of the index heavyweights which propelled the market higher. If we look at the chart, we had seen a pullback from a ‘Rising Trendline’ support in Nifty during last week. A follow up buying yesterday with a broad market participation is certainly an encouraging sign and hints at a probability of resumption of the broader uptrend. However, we are now at an important juncture in the index at 14875-14900 and 15050 which are resistances on short term charts. The index needs to surpass these with an authority which would then build a greater confidence going ahead. Hence, taking one step at a time and avoiding aggressive bets would be the advice for traders at these levels. A lot of sector/stock specific momentum could clearly be seen and hence, capitalizing on such ideas would be a better approach to ride this momentum. As far as index levels are concerned, 14700 would be seen as an immediate support while 14900 and 15050 are the resistances to watch out for.
Nifty Daily Chart
Nifty Bank Outlook - (33875)
After an extended weekend, our markets opened with a good bump up on the back of favourable cues from the global bourses. The banking too had a great start in tandem with benchmark to surpass the immediate hurdle of 33500. During the remaining part of the day, we witnessed a range bound action in most of the banking counters, but the bias remained strongly bullish. Eventually, the penultimate session of the financial year ended with slightly less than two percent gains for the banking index.
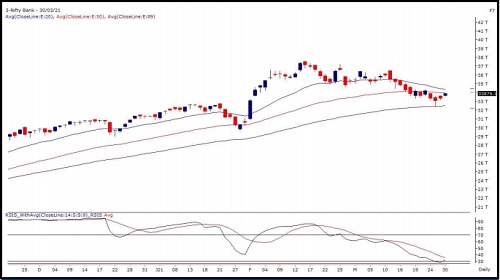
In last couple of sessions, BANKNIFTY has come off its lows quite swiftly after precisely testing the key support of ’89-EMA’ on daily chart. Now it has reached its cluster of resistance and hence, it would be interesting to see how it behaves here. As far as levels are concerned, 34000 – 34400 are to be seen as immediate hurdles; whereas yesterday’s lower range of 33600 – 33400 should act as intraday support. The real momentum would only be seen outside this range and hence, traders should focus on individual stocks till the time index remains in a consolidation
Nifty Bank Daily Chart
To Read Complete Report & Disclaimer Click Here
Please refer disclaimer at https://trade.angelbroking.com/Downloads/ARQ-Disclaimer-Note.pdf
SEBI Registration number is INH000000164
Views express by all participants are for information & academic purpose only. Kindly read disclaimer before referring below views. Click Here For Disclaimer


Tag News
On the higher side, immediate resistance is seen around 36000 - 36200 levels - Angel One


More News
Morning Nifty and Derivative comments 05 June 2023 By Anand James, Geojit Financial Services