


The daily and weekly strength indicator RSI is moving downwards and is quoting below its reference line - Axis Securities

Follow us Now on Telegram ! Get daily 10 - 12 important updates on Business, Finance and Investment. Join our Telegram Channel
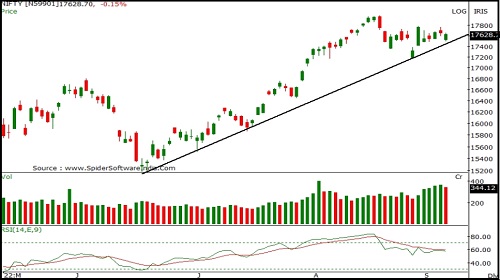
Nifty
Nifty opened sharply lower with a downward gap however buying support at lower levels recovered some of the earlier losses to close on a flat note. Nifty closed at 17624 with a loss of 31 points.
On the daily chart index has formed a bullish candle however continues to move in lower high-low formation indicating negative bias. Since past 10-12 sessions the index continues to consolidate in a broad trading range (17800-17350) representing a sideways trend. The chart pattern suggests that if Nifty crosses and sustains above 17700 level it would witness buying which would lead the index towards 17800-17900 levels. However if index breaks below 17600 level it would witness selling which would take the index towards 17500-17400. Nifty is trading above 50, 100 and 200 day SMA's indicating positive bias in the short to medium term. Nifty continues to remain in an uptrend for the short term, so buying on dips continues to be our preferred strategy.
The daily strength indicator RSI is moving downwards and is quoting below its reference line indicating negative bias.
The trend deciding level for the day is 17585. If NIFTY trades above this level then we may witness a further rally up to 17690-17755-17855 levels. However, if NIFTY trades below 17585 levels then we may see some profit booking initiating in the market, which may correct up to 17520-17420-17355 levels.
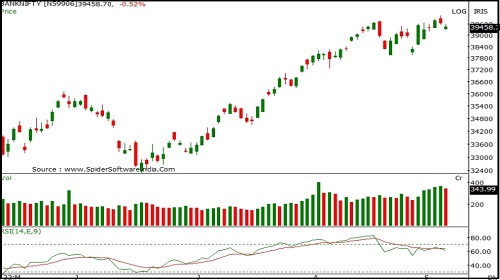
Banknifty
Banknifty opened with a downward gap and remained lackluster within a narrow range indicating absence of strength. Banknifty closed at 39456 with a loss of 211 points.
On the daily chart index has formed a bullish candle however it continues to form lower High-Low compared to previous session indicating negative bias. The index is moving in a Higher Top and Higher Bottom formation on the daily chart indicating a short term up trend. The chart pattern suggests that if Banknifty crosses and sustains above 39600 level it would witness buying which would lead the index towards 39800-40200 levels. However if the index breaks below 39300 level it would witness selling which would take the index towards 39000-38800. Banknifty is trading above 20, 50 , 100 and 200 day SMA's indicating positive bias in the short to medium term. Banknifty continues to remain in an uptrend in the short term, so buying on dips continues to be our preferred strategy.
The daily and weekly strength indicator RSI is moving downwards and is quoting below its reference line indicating negative bias.
The trend deciding level for the day is 39430. If BANK NIFTY trades above this level then we may witness a further rally up to 39600-39745-39915 levels. However, if BANK NIFTY trades below 39430 levels then we may see some profit booking initiating in the market, which may correct up to 39285-39115-38970 levels.
To Read Complete Report & Disclaimer Click Here
For More Axis Securities Disclaimer https://simplehai.axisdirect.in/disclaimer-home
SEBI Registration number is INZ000161633
Views express by all participants are for information & academic purpose only. Kindly read disclaimer before referring below views. Click Here For Disclaimer


More News
Quote on Market by Mr. S Hariharan, Emkay Global Financial Services


