The Nifty trend deciding level for the day is 16695 - Axis Securities

Follow us Now on Telegram ! Get daily 10 - 12 important updates on Business, Finance and Investment. Join our Telegram Channel
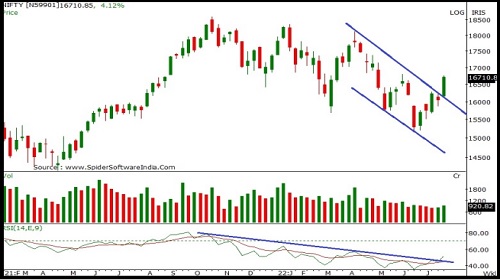
Nifty
Nifty started the week with an upward gap and buying momentum for most part of the week led it to close on a strong note. Nifty closed at 16719 with a gain of 670 points on a weekly basis. On the weekly chart the index has formed a long bullish candle forming higher High-low compared to previous week and has closed above previous week's high indicating positive bias. The index is moving in a Higher Top and Higher Bottom formation on the daily chart indicating positive bias. The chart pattern suggests that if Nifty crosses and sustains above 16800 levels it would witness buying which would lead the index towards 17000-17100 levels. However if the index breaks below 16600 level it would witness selling which would take the index towards 16400- 16200. Nifty is now well placed above its 20, 50 and 100 Day SMA indicating positive bias in the short term. Nifty continues to remain in an uptrend in the medium term, so buying on dips continues to be our preferred strategy. For the week, we expect Nifty to trade in the range of 17100-16400 with a positive bias. The daily and weekly strength indicator RSI is moving upwards and is quoting above its reference line indicating positive bias. The trend deciding level for the day is 16695. If NIFTY trades above this level then we may witness a further rally up to 16780-16835-16920 levels. However, if NIFTY trades below 16695 levels then we may see some profit booking initiating in the market, which may correct up to 16635-16555-16495 levels.
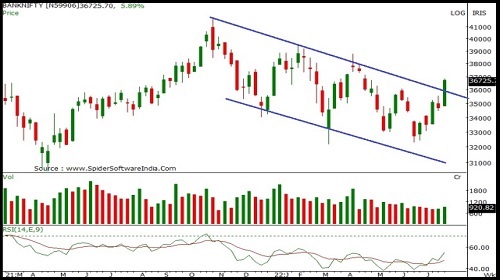
Bank Nifty
Bank Nifty started the week on a flat note and buying momentum throughout the week led it close on a strong note. Bank Nifty closed at 36739 with a gain of 2056 points on a weekly basis. On the weekly chart the index has formed a sizable bullish candle and closed above previous week's high indicating positive bias. The index is moving in a Higher Top and Higher Bottom formation on the daily chart indicating positive bias. The chart pattern suggests that if Bank Nifty crosses and sustains above 36900 level it would witness buying which would lead the index towards 37000-37500 levels. However if the index breaks below 36200 level it would witness selling which would take the index towards 36000-35500. Bank Nifty is trading above 20, 50,100 and 200 day SMA’s which are important short term moving averages, indicating positive bias in the short to medium term. Bank Nifty continues to remain in an uptrend in the short term, so buying on dips continues to be our preferred strategy. For the week, we expect Bank Nifty to trade in the range of 37500-35800 with a positive bias. The daily and weekly strength indicator RSI is moving upwards and is quoting above its reference line indicating positive bias. The trend deciding level for the day is 36615 If BANKNIFTY trades above this level then we may witness a further rally up to 36945-37155-37485 levels. However, if BANKNIFTY trades below 36615 levels.
To Read Complete Report & Disclaimer Click Here
For More Axis Securities Disclaimer https://simplehai.axisdirect.in/disclaimer-home
SEBI Registration number is INZ000161633
Views express by all participants are for information & academic purpose only. Kindly read disclaimer before referring below views. Click Here For Disclaimer


More News

Mid-Market Comment by Mr Shrey Jain, Founder and CEO SAS Online - India`s Deep Discount Broker