320-x-100_uti_gold.jpg" alt="Advertisement">

The Nifty trend deciding level for the day is 16085 - Axis Securities

Follow us Now on Telegram ! Get daily 10 - 12 important updates on Business, Finance and Investment. Join our Telegram Channel
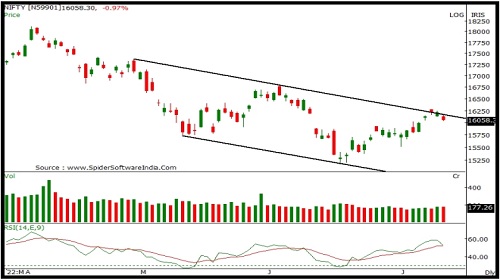
Nifty
Nifty opened sharply lower with a downward gap and selling pressure for most part of the session led it lower to close in negative terrain. Nifty closed at 16058 with a loss of 158 points. On the daily chart, the index has formed a bearish candle forming lower High-Low and has also closed below previous session low indicating further weakness. The index is moving in a Higher Top and Higher Bottom formation on the daily chart indicating an up trend. The chart pattern suggests that if Nifty crosses and sustains above 16100 level it would witness buying which would lead the index towards 16200-16300 levels. However if the index breaks below 16000 level it would witness selling which would take the index towards 15900-15800. Nifty is trading above its 20 and 50 day SMA which indicates positive bias in the short term. Nifty continues to remain in an uptrend for the short term, so buying on dips continues to be our preferred strategy. The daily strength indicator RSI has turned positive from the oversold territory and is above its reference line indicating positive bias. The trend deciding level for the day is 16085. If NIFTY trades above this level then we may witness a further rally up to 16135-16210-16260 levels. However, if NIFTY trades below 16085 levels then we may see some profit booking initiating in the market, which may correct up to 16005-15955-15880 levels.
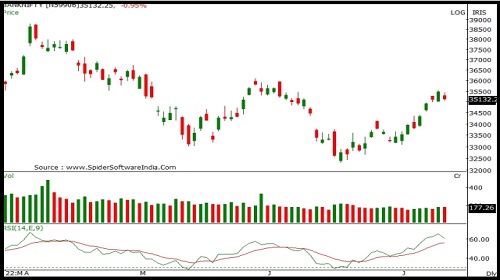
Bank Nifty
Banknifty opened with a downward gap and selling pressure throughout the session led it to close in negative terrain. Banknifty closed at 35132 with a loss of 337 points. On the daily chart index has formed a bearish candle however it remained restricted within previous session's High-Low range indicating absence of strength on either side. The index is moving in a Higher Top and Higher Bottom formation on the daily chart indicating a short term up trend. The chart pattern suggests that if Banknifty crosses and sustains above 35300 level it would witness buying which would lead the index towards 35500-35800 levels. However if index breaks below 35000 level it would witness selling which would take the index towards 34800-34600. Banknifty is trading above 20, 50 and 100 day SMA's indicating positive bias in the short to medium term. Banknifty continues to remain in an uptrend in the short term, so buying on dips continues to be our preferred strategy. The daily strength indicator RSI is moving upwards and is above its reference line indicating positive bias. The trend deciding level for the day is 35200. If BANK NIFTY trades above this level then we may witness a further rally up to 35350-35570-35725 levels. However, if BANK NIFTY trades below 35200 levels then we may see some profit booking initiating in the market, which may correct up to 34980-34830-34610 levels.
To Read Complete Report & Disclaimer Click Here
For More Axis Securities Disclaimer https://simplehai.axisdirect.in/disclaimer-home
SEBI Registration number is INZ000161633
Views express by all participants are for information & academic purpose only. Kindly read disclaimer before referring below views. Click Here For Disclaimer


More News

India VIX decreased by 2.10% to close at 20.89 touching an intraday high of 21.55 - Nirmal Bang