320-x-100_uti_gold.jpg" alt="Advertisement">

The Nifty started the week with a negative gap (17172-17009) and drifted southward during the session - ICICI Direct

Follow us Now on Telegram ! Get daily 10 - 12 important updates on Business, Finance and Investment. Join our Telegram Channel
Nifty : 16954
Technical Outlook
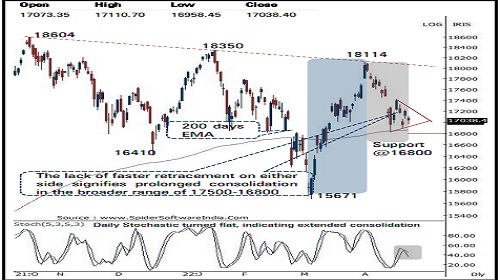
• The Nifty started the week with a negative gap (17172-17009) and drifted southward during the session. However, supportive efforts from the lower band of consolidation placed at 16800 coincided with 200 days EMA helped index to minimise the intraday losses. As a result, daily price action formed a bear candle with lower shadows, highlighting supportive efforts at lower levels
• The index has been witnessing lack of faster retracement as over past thirteen sessions index has retraced 50% of preceding 19 sessions rally (15671-18114), indicating extended consolidation in the broader range of 17500-16800. Going ahead, only a decisive close below 16800 would lead to extended correction, else prolonged consolidation. Meanwhile, 17500 will continue to act as immediate resistance for the Nifty as it is confluence of:
• a) last week’s falling gap area (17475-17238)
• b) 50% retracement of April decline (18114-16825)
• The broader market indices are consolidating in the vicinity of 200 days EMA. Historically, in a secular bull market intermediate correction towards 200 days EMA help index to cool off the overbought condition and make market healthy. We believe, base formation from hereon would set the stage for next leg of up move amid ongoing Q4FY22 earning season
• Structurally, the formation of higher trough on the weekly chart signifies robust price structure highlighting strong support base at 16800 which we expect to hold on a closing basis as it is confluence of:
• A) 50% retracement of the entire March 2022
• B) 200 days EMA placed at 16850 In the coming session, index is likely to witness gap up opening tracking firm global cues. Nifty is once again staging pullback from key support of 200 days EMA. Hence, after a positive opening use dip towards 17015-17042 for creating long position for the target of 17129
NSE Nifty Daily Candlestick Chart
Nifty Bank: 36082
Technical Outlook
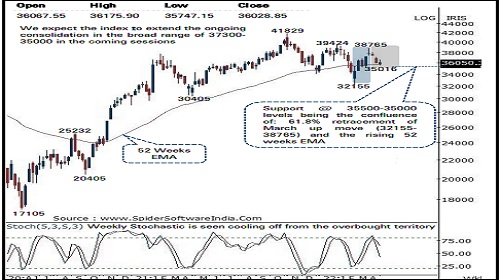
• The daily price action formed a counter attack bull candle as it opened lower but recovered its intraday decline to close on a flat note highlighting buying demand emerging around the major support area of 35500 -35000 levels .
• Going ahead, we expect the index to trade with positive bias while extending the ongoing consolidation in the broad range of 35000 -37300 levels amid stock specific activity as indicated by lack of faster retracement on either side
• On the higher side 37300 is likely to act as major hurdle being the confluence of the last Monday’s gap down area and the 50 % retracement of recent decline (38765 -35926 )
• Structurally, the current corrective decline is shaping out as a retracement of strong 20 % rally from March 2022 lows (32156 ) which will help the index to work out of overbought conditions in the weekly time frame . We expect the index to hold above the strong support area of 35500 -35000 levels as it is confluence of :
• (a) 61 . 8 % retracement of the entire March 2022 up move (32155 -38765 ) placed at 34800 levels
• (b) The rising 52 weeks EMA is also placed around 35500 levels
• (c ) The recent swing low of second half of March 2022 is also placed around 35000 levels
• Among the oscillators the weekly stochastic is seen cooling off from the overbought territory and is currently placed at a reading of 48 indicating prolongation of the current consolidation . In the coming session, index is likely to open on a positive note tracking pullback in global equity market . We expect index to continue with its previous session pullback . Hence, after a positive opening use intraday dips towards 36200 -36280 for creating long position for the target of 36540 , maintain a stoploss at 36090
Nifty Bank Index – Weekly Candlestick Chart
To Read Complete Report & Disclaimer Click Here
https://secure.icicidirect.com/Content/StaticData/Disclaimer.html
Above views are of the author and not of the website kindly read disclaimer