The Nifty extended its record setting spree over a third consecutive session as the Nifty scaled a fresh all-time high of 15661 - ICICI Direct

Follow us Now on Telegram ! Get daily 10 - 12 important updates on Business, Finance and Investment. Join our Telegram Channel
NSE (Nifty):15575
Technical Outlook
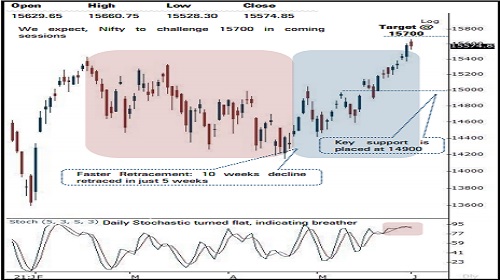
* The Nifty extended its record setting spree over a third consecutive session as the Nifty scaled a fresh all-time high of 15661. Subsequently, index underwent minor profit booking as it approached in the vicinity of our earmarked target of 15700. As a result, daily price action formed a high wave candle carrying higher high-low, indicating breather after past 12 sessions 1070 points rally
* We reiterate our positive stance and expect the Nifty to challenge the 15700 mark in coming sessions. We believe, a temporary breather at higher levels would make market healthy and offer incremental buying opportunity as the broader positive structure still remains robust
* Despite temporary breather, 83% components of Nifty 500 index are trading above 50 days EMA compared to April reading of 60%. Rejuvenated market breadth signifies inherent strength that augurs well for durability of ongoing up trend. Hence, extended breather from here on should not be construed as negative, instead capitalise to accumulate quality stocks to ride next leg of up move
* In line with benchmark, broader market indices took a breather after two consecutive week’s sharp up move. We expect Nifty midcap and small cap indices to regain momentum after temporary breather as the broader market breadth still remains sturdy. Currently ~80% of index components are trading above their 50 days EMA compared to April reading of ~60%
* Structurally, the formation of higher high-low signifies elevated buying demand that makes us confident to retain support base at 14900 as it is confluence of:
* a) 80% retracement of past three week’s rally (14725-15661), at 14912
* b) 50 days EMA is placed at 14882
* In the coming session, the index is likely to open on a flat note amid mixed global cues. The formation of higher high-low signifies elevated buying demand. Hence, after a flat opening use intraday dip towards 15560-15587 to create long for target of 15675.
NSE Nifty Daily Candlestick Chart
Nifty Bank: 35337
Technical Outlook
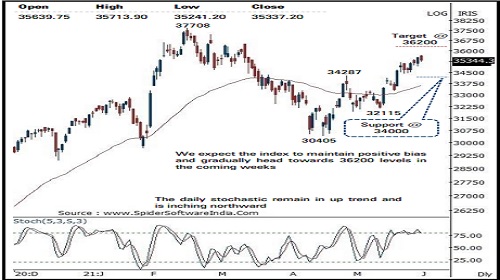
* The daily price action formed a small bear candle indicating minor profit booking after the recent sharp up move . The index however maintained higher high -low signalling overall positive bias in the short term .
* positive bias in the short term . • Going forward, we reiterate our positive stance with target of 36200 in coming weeks as it is the confluence of the 80 % retracement of the entire last three months corrective decline (37708-30405) and the price parity with previous up move (30405-34287) as projected from the recent trough of 32115 signalling upside towards 36200 levels .
* The index has witnessed a sharp rally of more than 11 % in just 12 sessions . Hence, a temporary breather from higher levels cannot be ruled out . However, we believe such a breather should not be seen as negative instead it should be capitalised to accumulate quality banking stocks
* The formation of higher high -low on the weekly chart signifies elevated buying demand that makes us confident to revise the support base higher towards 34000 levels as it is confluence of the following technical observations :
* a) 38 . 2 % retracement of the current up move (32115 -35463 )
* b) the recent breakout area and the April high (34287 )
* c) the rising 50 days EMA also placed around 33700 levels
* In the coming session, the index is likely to open on a flat note amid muted global cues . We expect the index to trade with positive bias after a flat opening . Hence use intraday dips towards 35280 -35340 for creating long position for the target of 35580 , maintain a stoploss of 35160
* Among the oscillators the daily stochastic remain in up trend and is inching northward, indicating overall positive bias in the index in the short term
Nifty Bank Index – Daily Candlestick Chart
To Read Complete Report & Disclaimer Click Here
https://secure.icicidirect.com/Content/StaticData/Disclaimer.html
Views express by all participants are for information & academic purpose only. Kindly read disclaimer before referring below views. Click Here For Disclaimer





Top News

Atishay touches roof on securing work order from Ayushman Bharat - Haryana Health Protection...
Tag News

Stock Picks : TCS Ltd And Chambal Fertiliser Ltd By ICICI Direct


