The Bank Nifty trend deciding level for the day is 33380 - Axis Securities

Follow us Now on Telegram ! Get daily 10 - 12 important updates on Business, Finance and Investment. Join our Telegram Channel
Nifty
Nifty opened on a flat note and remained in a small range throughout the day. Nifty closed at 15692 with a loss of 40 points. On the daily chart index has formed a bearish candle however it remained restricted within previous session's HighLow range indicating absence of strength on eitherside. The index is moving in a Lower Top and Lower Bottom formation on the daily chart indicating negative bias. The chart pattern suggests that if Nifty crosses and sustains above 15800 level it would witness buying which would lead the index towards 15900-16000 levels. However if index breaks below 15600 level it would witness selling which would take the index towards 15500-15300. Nifty is trading below 20 day SMA indicating negative bias in the short to medium term. Nifty continues to remain in a downtrend in the short to medium term, so selling on rallies continues to be our preferred strategy. The daily strength indicator RSI is moving downwards and is quoting below its reference line indicating negative bias. The trend deciding level for the day is 15720. If NIFTY trades above this level then we may witness a further rally up to 15760-15825-15860 levels. However, if NIFTY trades below 15720 levels then we may see some profit booking initiating in the market, which may correct up to 15655-15615-15550 levels.

Bank Nifty
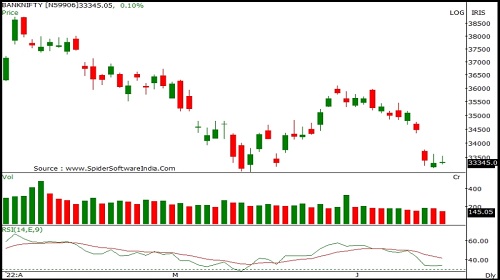
Banknifty opened on a flat note and remained in a small range throughout the day. Banknifty closed at 33339 with a gain of 28 points. On the daily chart the index has formed a small Bullish candle with upper shadow indicating selling pressure as well as resistance at higher levels. The index is moving in a Lower Top and Lower Bottom formation on the daily chart indicating negative bias. The chart pattern suggests that if Banknifty crosses and sustains above 33600 level it would witness buying which would lead the index towards 33800-34000 levels. However if index breaks below 33200 level it would witness selling which would take the index towards 33000-32700. Banknifty is trading above 20 day SMA's indicating positive bias in the short to medium term. Banknifty continues to remain in a downtrend in the short to medium term, so selling on rallies continues to be our preferred strategy. The daily and weekly strength indicator RSI is moving downwards and is quoting below its reference line indicating negative bias. The trend deciding level for the day is 33380. If BANK NIFTY trades above this level then we may witness a further rally up to 33515-33685-33820 levels. However, if BANK NIFTY trades below 33380 levels then we may see some profit booking initiating in the market, which may correct up to 33210-33075-32905 levels.
To Read Complete Report & Disclaimer Click Here
For More Axis Securities Disclaimer https://simplehai.axisdirect.in/disclaimer-home
SEBI Registration number is INZ000161633
Views express by all participants are for information & academic purpose only. Kindly read disclaimer before referring below views. Click Here For Disclaimer


Top News

Jindal India Institute trains over 30 foreign diplomats, journalists to deepen understanding...


More News

Domestic indices likely to make positive start of new week