320-x-100_uti_gold.jpg" alt="Advertisement">

The Bank Nifty trend deciding level for the day is 32680 - Axis Securities

Follow us Now on Telegram ! Get daily 10 - 12 important updates on Business, Finance and Investment. Join our Telegram Channel
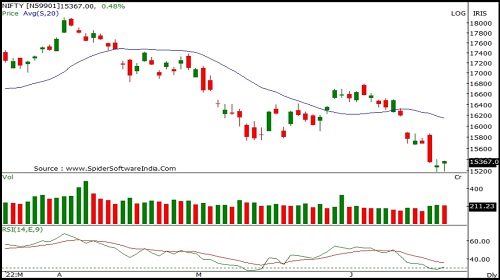
Nifty
Nifty opened on a flat note and remained in a small range throughout the day. Nifty closed at 15350 with a gain of 57 points. On the daily chart the index has formed a "Doji" candlestick formation indicating indecisiveness amongst market participants regarding the direction. The index is moving in a Lower Top and Lower Bottom formation on the daily chart indicating negative bias. The chart pattern suggests that if Nifty crosses and sustains above 15400 level it would witness buying which would lead the index towards 15500-15600 levels. However if index breaks below 15300 level it would witness selling which would take the index towards 15200-15100. Nifty is trading below 20 day SMA indicating negative bias in the short to medium term. Nifty continues to remain in a downtrend in the short to medium term, so selling on rallies continues to be our preferred strategy. The daily strength indicator RSI is moving downwards and is quoting below its reference line indicating negative bias. The trend deciding level for the day is 15310. If NIFTY trades above this level then we may witness a further rally up to 15425-15500-15615 levels. However, if NIFTY trades below 15310 levels then we may see some profit booking initiating in the market, which may correct up to 15235-15115-15040 levels.
Bank Nifty
Banknifty opened on a flat note and remained in a small range throughout the day. Banknifty closed at 32685 with a loss of 58 points. On the daily chart the index has formed a Bearish candle with a lower shadow indicating buying at lower levels. The index is moving in a Lower Top and Lower Bottom formation on the daily chart indicating negative bias. The chart pattern suggests that if Banknifty crosses and sustains above 32800 level it would witness buying which would lead the index towards 33000-33300 levels. However if index breaks below 32400 level it would witness selling which would take the index towards 32200-31800. Banknifty is trading below 20, 50, 100 and 200 day SMA indicating negative bias in the short to medium term. Banknifty continues to remain in a downtrend in the short to medium term, so selling on rallies continues to be our preferred strategy. The daily and weekly strength indicator RSI is moving downwards and is quoting below its reference line indicating negative bias. The trend deciding level for the day is 32680. If BANK NIFTY trades above this level then we may witness a further rally up to 32930-33180-33430 levels. However, if BANK NIFTY trades below 32680 levels then we may see some profit booking initiating in the market, which may correct up to 32430-32180-31930 levels.

To Read Complete Report & Disclaimer Click Here
For More Axis Securities Disclaimer https://simplehai.axisdirect.in/disclaimer-home
SEBI Registration number is INZ000161633
Views express by all participants are for information & academic purpose only. Kindly read disclaimer before referring below views. Click Here For Disclaimer


Top News

Nitin Gadkari emphasises on reduction of logistics cost to 10% with cooperation, coordinatio...


More News

The awaited reversal formation seems to be established on its daily scaleat 16820support zon...