Stock of the week - CADILAHC for The immediate resistance for the stock is placed at 600 By GEPL Capital

Follow us Now on Telegram ! Get daily 10 - 12 important updates on Business, Finance and Investment. Join our Telegram Channel
Observation
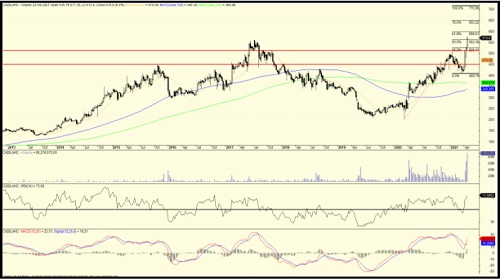
* CADILAHC for the past 4 weeks has been forming a higher high higher low pattern. In the week that passed by the stock tested a fresh 52 week high. This up move was backed by increasing volume, indicating participation as the prices move higher.
* On the daily time frame the long term moving averages are placed at 20 Day SMA (479) 100 Day SMA (465) and the 200 Day SMA (431). Currently the prices are placed above all the long term moving averages.
* On the indicator front the MACD plotted on the weekly tine frame has sharply formed a bullish crossover, indicating presence of bullishness in the trend. The RSI moving placed above the 50 mark and moving higher, indicating presence of momentum in the bullish trend.
* The immediate resistance for the stock is placed at 600 (61.8% extension level of the rise from 202-509 projected from 408) followed by 650 (78.6% extension level of the rise from 202-509 projected from 408) and eventually towards 715 (100% extension level of the rise from 202-509 projected from 408)
* The 510 (weekly low), will act as a support level, if this level is breached we can expect the prices to move lower towards 480-470 (2 week low)


To Read Complete Report & Disclaimer Click Here
SEBI Registration number is INH000000081.
Please refer disclaimer at https://geplcapital.com/term-disclaimer
Views express by all participants are for information & academic purpose only. Kindly read disclaimer before referring below views. Click Here For Disclaimer


 320-x-100_uti_gold.jpg" alt="Advertisement">


