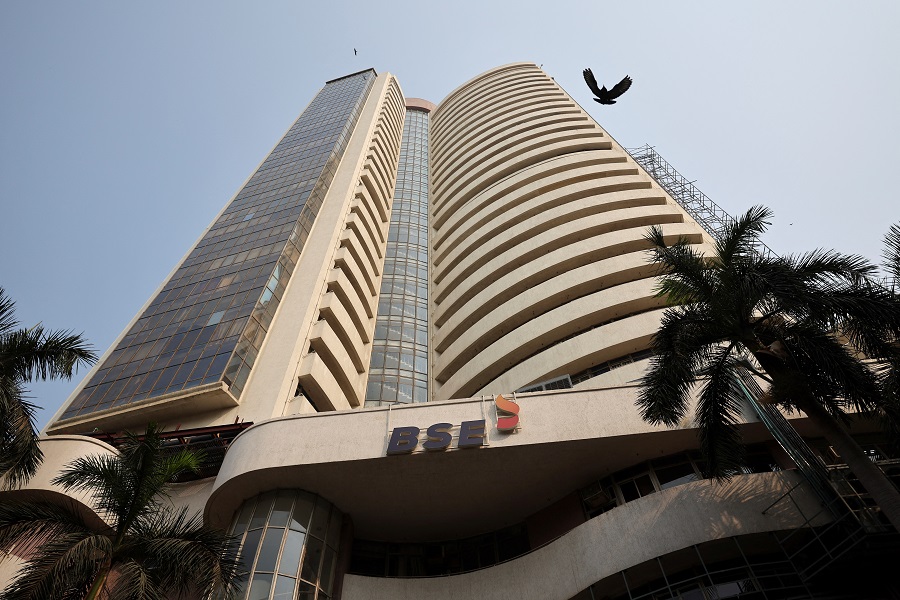
Sensex closes at 50K mark; 1st time in its history - Motilal Oswal

Sensex closes at 50K mark; 1st time in its history
In flashback – 1986 to 2021
* For the first time in history, the Sensex has closed above the psychological mark of 50k on 3rd Feb 2021. While the first 25k took ~28 years, the second 25k milestone has come in the last ~7 years. The index has, indeed, come a long way from its humble beginnings in 1986, when it traded at 549, while setting the base year of 1978–79 as 100. On this spectacular journey, the Sensex has mirrored the economic growth of the country from the pre-liberalization phase to now emerge as one of the top economies of the world while overcoming the challenges of Asian financial crisis, dot com bubble, Global financial crisis, taper tantrum to covid pandemic and coming out triumphant.
* The recent sprint to 50k now in Feb’21, from pandemic lows of 26k in Mar’20 – amid lockdowns and other health challenges – has been led by a benign global liquidity backdrop, better containment of COVID-19 cases, sharp recovery in corporate earnings, and a market-friendly budget.
* In this note, through select interesting exhibits, we traverse the Sensex’s journey from 549 in 1986 to 50k today.
Sensex up 91x in ~35 years – a non-linear journey
* While traversing its journey from 549 to 50k, the Sensex, up 91x, has delivered 13.6% CAGR returns in the last 35 years. While the returns have been impressive, this has been a non-linear journey (as shown in Exhibit 3).
* CY’1991 – the year in which India ushered in a new era by breaking the barriers of the ‘License-control Raj’ – was the best year of annual returns, with the Sensex delivering 82% gains. On the other hand, CY2008, the year of the Global Financial Crisis (GFC), was the worst year, with the Sensex ending the year with a 52% decline.
* In the last 35 years, the Sensex has given calendar annual returns of >20% over 14 years, while it fell more > 10% over 7 calendar years.
* The Sensex’s journey from 549 to 5k was the most excruciating, as it took a total of 3,034 trading days (almost 14 years). The move from 20k to 25k was also prolonged (1,607 trading days or 6.5 years) as the markets took time to recover from the long phase of correction in the aftermath of the GFC in 2008. On the other hand, the move from 45k to 50k has been the quickest as it has been covered over just 41 days. Of course, as the levels move higher, every 1k point journey implies lower percentage returns.
Sunrise and Sunset: Some sectors gained prominence, others have faded
* Over the years, the sectoral representation of the Sensex has undergone a world of change. In fact, the representation of sectors remains in consonance with the changes in the underlying economy. The Sensex in Mar’90 had zero representation from private sector banks and was dominated by industrial sectors such as Metals, Cement, and Capital Goods. With a) the change in the economy from Manufacturing to Services over the past three decades and b) the rise of the private sector post liberalization, the sectoral representation in 2021 is vastly different from that of 1990.
* The Top 2 sectors in 2021 – Private Banks (28.5%) and Technology (17.7%) – had zero representation in the Sensex in 1990. Similarly, NBFCs, with 12.4% weight in the Sensex, had zero weight in 1990.
* Cement and Capital Goods have also seen massive decline in weights to 1.3%/3.4% now in 2021 from 12.5%/10% in 1990. With Tata Steel being replaced in the Sensex with Dr Reddy’s Labs in Dec’20, the Sensex now has zero representation from Metals – a sector which had 26.3% weight in 1990. Similarly, Fertilizers (5.8%), Textiles (4.3%), Shipping (2.5%), Paper (1.6%), and Hotels (1.0%) are no longer a part of the Sensex.
* Consumer and Auto weights have dropped to 10.2%/4.3% in 2021 from 14.7%/12% in 1990. On the other hand, sectors that have gained weight include Oil & Gas (from 7.3% to 12%), largely on account of Reliance. Healthcare and Utilities have seen minor increase in weights.
Only four companies have traversed the entire journey!
* Out of the 30 stocks in the Sensex, only four companies – RIL, HUL, ITC, and L&T – have been a part of the index’s journey since inception.
* The combined market-cap of these four companies has grown at a CAGR of 23% between Jan’1988 and Feb’2021. This can be broken down into two phases – one wherein the market cap expanded at a CAGR of 32% between Jan’1988 and Dec’2007 and another wherein an 8% CAGR was reported between Dec’2007 and Jan’2021.
Valuation multiples changed in line with underlying change in constituents
* In line with the change in the underlying composition of the Sensex, the valuation multiples of the Sensex have also moved up.
* The average P/E multiple of the Sensex between April’1993 and Feb’2021 stands at 16.6x; however, the average for the last 10 years is 19.5x.
To Read Complete Report & Disclaimer Click Here
For More Motilal Oswal Securities Ltd Disclaimer http://www.motilaloswal.com/MOSLdisclaimer/disclaimer.html SEBI Registration number is INH000000412
Above views are of the author and not of the website kindly read disclaimer