Sell Gold Below 50000 SL ABOVE 50100 TGT 49900/49800 - Axis Securities

Follow us Now on Telegram ! Get daily 10 - 12 important updates on Business, Finance and Investment. Join our Telegram Channel
CRUDE OIL
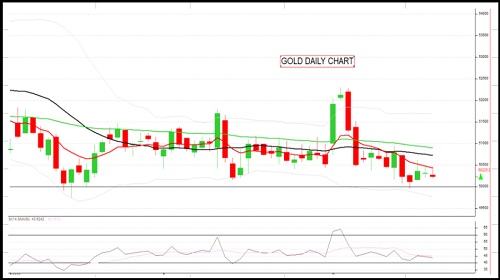
Gold opened on a flat note and remained in a Small range throughout the day. Gold closed at 50225 with a loss of 95 points. The daily strength indicator RSI continue to remian flat and is below its reference line indicating absence of momentum on either side. The daily price movement has taken a shape of “Gravestone Doji” bearish reversal pattern candlestick pattern which signals session is overcome by bears. However a break below important support zone of (50000) will confirm the above said pattern. On hourly chart Gold is trading below 20 and 60 day EMA's which indicate negative bias in the short term. Important level to watch out is 50000 level.
SELL GOLD BELOW 50000 SL ABOVE 50100 TGT 49900/49800
COPPER
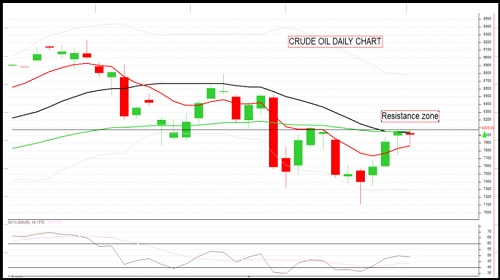
Crude Oil opened with an downward gap but witnessed buying in the secound half of the ssession. It managed to close on a flat note. Crude Oil closed at 8009 with a loss of 47 points. The daily strength indicator RSI continue to remian flat and is above its reference line indicating absence of momentum on either side. On the daily chart the It has formed a "Doji" candlestick formation indicating indecisiveness amongst market participants regarding the direction. On hourly chart Crude Oil is trading above 20 and 60 day EMA's indicating positive bias in the short term. However prices is not able to sustain above 8100 from past few days. Selling is recommended near the mentioned level for the target of 8050.
SELL CRUDE OIL AROUND 8100 SL ABOVE 8150 TGT 8050/8000
To Read Complete Report & Disclaimer Click Here
For More Axis Securities Disclaimer https://simplehai.axisdirect.in/disclaimer-home
SEBI Registration number is INZ000161633
Views express by all participants are for information & academic purpose only. Kindly read disclaimer before referring below views. Click Here For Disclaimer




 320-x-100_uti_gold.jpg" alt="Advertisement">


