320-x-100_uti_gold.jpg" alt="Advertisement">

Nifty daily chart has formed `Descending broadening wedge`pattern. - Enrich Financial

Follow us Now on Telegram ! Get daily 10 - 12 important updates on Business, Finance and Investment. Join our Telegram Channel
NIFTY MORNING OUTLOOK
Pre-Market Monday! Asian market negative trading, Nifty50 on the SGX were trading lower at 17142.80 -118.45 points on indicating gap down opening for the NSE. At the close in NSE, the Nifty 50 fell 1.31%, while the BSE Sensex 30 index declined 1.31%
The biggest gainers of the session on the Nifty 50 were Indian Oil Corporation Ltd, which rose 1.79% or 2.15 points to trade at 122.10 at the close. IndusInd Bank Ltd. added 1.03% or 10.05 points to end at 982.40 and Tata Steel Ltd was up 0.49% or 6.10 points to 1254.45 in late trade. Biggest losers included Grasim Industries Ltd, which lost 3.30% or 58.40 points to trade at 1710.15 in late trade. Tech Mahindra Ltd declined 2.97% or 43.60 points to end at 1424.90 and Infosys Ltd shed 2.73% or 48.25 points to 1721.35. The breadth, indicating the overall health of the market, 2289 fell and 917 advanced, while 98 ended unchanged on the India National Stock Exchange.
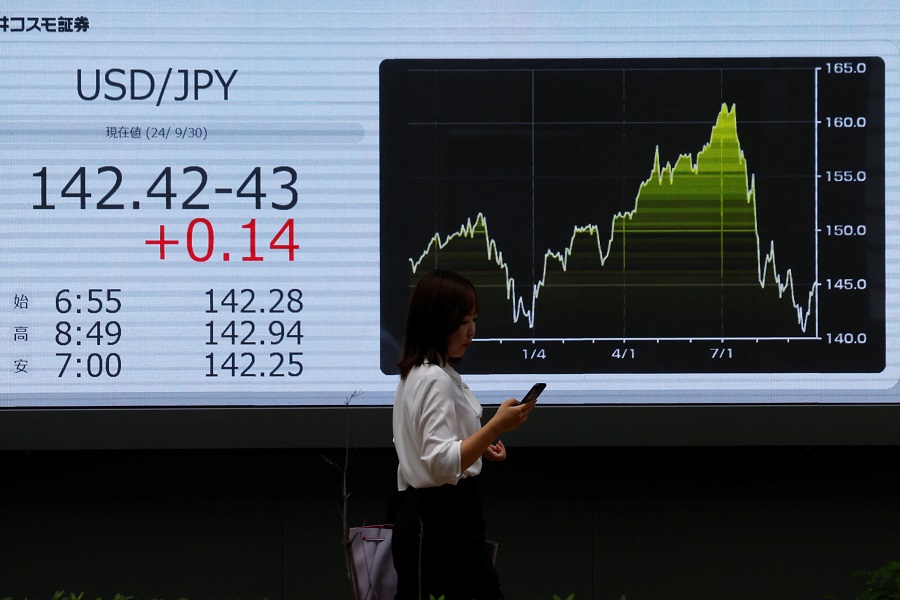
Rupee desk: The USD/INR was down 0.02% to 75.366.
Technical outlook
Nifty daily chart has formed "Descending broadening wedge" pattern. The Nifty has traded lower and closed in red on the last session. Technically, short covering seems to be ruled out. We expect to see a long gap down today. The market is expected to continue on bearish momentum based on the current price action, once the same break below the crucial support level near 17300. The downside rally could be testing all the way up to 17150-17000 levels in the upcoming sessions. Alternatively, if the market struggles to break the support, then it might retest the same and revise the trend to bullish/sideways mode once again as long as the stiff resistance holds near17500. A slide to 17650-17800 is also a possibility if the price makes or break above the current resistance level.
Technical Chart

To Read Complete Report & Disclaimer Click Here
For More Axis Securities Disclaimer https://simplehai.axisdirect.in/disclaimer-home
SEBI Registration number is INZ000161633
Above views are of the author and not of the website kindly read disclaimer


Top News
SBI reduces home loan rate to 6.70%
Tag News

MCX Gold June futures technical chart has taken the formation of “Ascending broadening wedge...