Nifty started the week with on a flat note and traded wuth extreme volatility - Axis Securities

Follow us Now on Telegram ! Get daily 10 - 12 important updates on Business, Finance and Investment. Join our Telegram Channel
Nifty
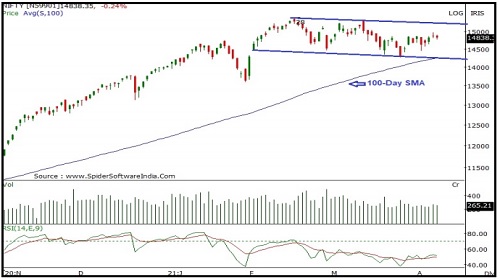
Nifty started the week with on a flat note and traded wuth extreme volatility on the eitherside which led it to close in negative territory. Nifty closed at 14835 with a loss of 33 points on a weekly basis. On the weekly chart the index has formed a "Doji" candlestick formation indicating indecisiveness amongst market participants regarding the direction. Since past 3-4 weeks index is consolidating within broad range of 15000-14400 levels representing sideways trend.
The chart pattern suggests that if Nifty crosses and sustains above 15000 levels it would witness buying which would lead the index towards 15150-15300 levels. Important Support for the week is around 14500-14400. Nifty is now well placed above its 100 SMA indicating positive bias in the short term. Nifty continues to remain in an uptrend in the medium term, so buying on dips continues to be our preferred strategy. For the week, we expect Nifty to trade in the range of 15000-14500 with mixed bias.
The weekly strength indicator RSI is moving downwards and is quoting below its reference line indicating negative bias. However momentum oscillator Stochastic has turned positive from the oversold zone indicating a possible consolidation or an up-move in the near term. The trend deciding level for the day is 14845.
If NIFTY trades above this level then we may witness a further rally up to 14905-14980-15040 levels. However, if NIFTY trades below 14845 levels then we may see some profit booking initiating in the market, which may correct up to 14775-14715-14640 levels.
Bank Nifty
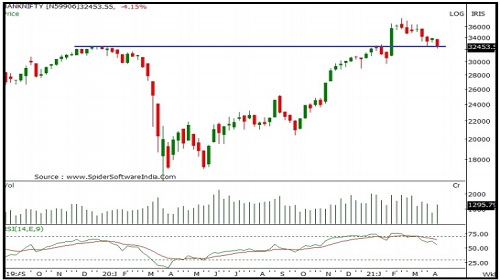
Bank Nifty started the week on a flat note and selling pressure throughout the week led it close at 32448 with a loss of 1410 points on a weekly basis. On the weekly chart the index has formed a sizable bearish candle and closed below the previous week's low indicating weakness on a short term basis. The index is moving in a Lower Top and Lower Bottom formation on the daily chart indicating negative bias.
The chart pattern suggests that if Bank Nifty crosses and sustains above 33000 level it would witness buying which would lead the index towards 33600-34200 levels. However if index breaks below 32000 level it would witness selling which would take the index towards 31500-31000. Bank Nifty is trading below 20-day, 50-day and 100-day SMA's which are important short term moving average, indicating negative bias in the short to medium term.
Bank Nifty continues to remain in an uptrend in the medium term, so buying on dips continues to be our preferred strategy. For the week, we expect Bank Nifty to trade in the range of 32200-31000 with a negative bias. The weekly strength indicator RSI and momentum oscillator Stochastic have both turned negative and are below their respective reference lines indicating negative bias.
The trend deciding level for the day is 32585 If BANKNIFTY trades above this level then we may witness a further rally up to 32835-33225-33480 levels. However, if BANKNIFTY trades below 32585 levels then we may see some profit booking initiating in the market, it may correct up to 32195-31940-31550 levels.
To Read Complete Report & Disclaimer Click Here
For More Axis Securities Disclaimer https://simplehai.axisdirect.in/disclaimer-home
SEBI Registration number is INZ000161633
Views express by all participants are for information & academic purpose only. Kindly read disclaimer before referring below views. Click Here For Disclaimer