320-x-100_uti_gold.jpg" alt="Advertisement">

Nifty started the week on a positive note but witnessed selling at higher levels - Axis Securities

Follow us Now on Telegram ! Get daily 10 - 12 important updates on Business, Finance and Investment. Join our Telegram Channel
Nifty
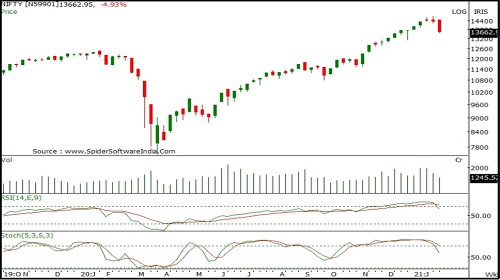
Nifty started the week on a positive note but witnessed selling at higher levels to end the week on weak note. Nifty closed at 13635 with a loss of 737 points on a weekly basis.
On the weekly chart the index has formed a long bearish candle forming lower High-Low compare to previous week indicating weaknes at current levels. The index is moving in a Higher Top and Higher Bottom formation on the weekly chart indicating positive bias. The chart pattern suggests that if Nifty crosses and sustains above 14000 level it would witness buying which would lead the index towards 14300-14600 levels. However if index breaks below 13500 level it would witness selling which would take the index towards 13300-13000. Nifty is trading below 20-day and 50-day SMA’s which are important short term moving average, indicating negative bias in the short to medium term. Nifty continues to remain in an uptrend in the medium term, so buying on dips continues to be our preferred strategy. For the week, we expect Nifty to trade in the range of 14300-13100 with mixed bias.
The weekly strength indicator RSI and momentum oscillator Stochastic have both turned negative and are below their respective reference lines indicating negative bias.
Bank Nifty
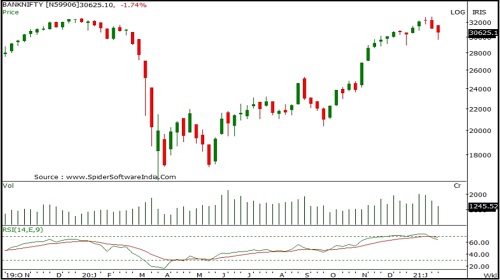
Bank Nifty started the week on a positive note but witnessed selling at higher levels to end the week on weak note. Bank Nifty closed at 30566 with a loss of 602 points on a weekly basis.
On the weekly chart the index has formed a long bearish candle forming lower High-Low compare to previous week and has closed below its low indicating weakness at current levels. The index is moving in a Higher Top and Higher Bottom formation on the weekly chart indicating sustained up trend on long term charts. The chart pattern suggests that if Bank Nifty breaks and sustains below 29600 level it would witness selling which would lead the index towards 29000-28100 levels. However if index crosses above 31300 level it would witness buying which would take the index towards 32200-32800. Bank Nifty is trading below 20-day and 50-day SMA's which are important short term moving average, indicating negative bias in the short to medium term. Bank Nifty continues to remain in an uptrend in the medium term, so buying on dips continues to be our preferred strategy. For the week, we expect Bank Nifty to trade in the range of 31500-28500 with mixed bias.
The weekly strength indicator RSI and momentum oscillator Stochastic have both turned negative and are below their respective reference lines indicating negative bias. The trend deciding level for the day is 30645 If BANKNIFTY trades above this level then we may witness a further rally up to 31035-31500-31890 levels. However, if BANKNIFTY trades below 30645 levels then we may see some profit booking initiating in the market, it may correct up to 30175-29785-29320 levels
To Read Complete Report & Disclaimer Click Here
For More Axis Securities Disclaimer https://simplehai.axisdirect.in/disclaimer-home
SEBI Registration number is INZ000161633
Views express by all participants are for information & academic purpose only. Kindly read disclaimer before referring below views. Click Here For Disclaimer