Nifty opened with a downward gap and traded with extreme volatility - Axis Securities

Follow us Now on Telegram ! Get daily 10 - 12 important updates on Business, Finance and Investment. Join our Telegram Channel
https://t.me/InvestmentGuruIndiacom
Download Telegram App before Joining the Channel
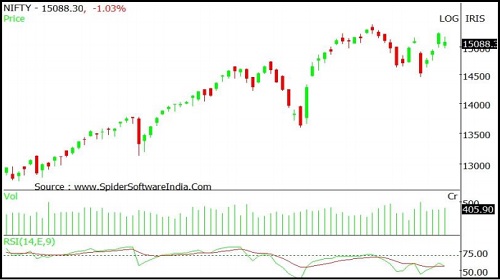
NIFTY
Nifty opened with a downward gap and traded with extreme volatility on either side and witnessed profit booking at the end of the day. Nifty closed at 15081 with a loss of 165 points.
On the daily chart the index has formed a small Bullish candle with upper shadow indicating selling pressure as well as resistance at higher levels. The index continues to move in a Higher Top and Higher Bottom formation on the hourly chart indicating positive bias. The chart pattern suggests that if Nifty breaks and sustains below 15000 level it would witness selling which would lead the index towards 14900-14700 levels. Important Resistances for the day are placed at 15300-15400. Nifty is trading above 20 and 50 day SMA's indicating positive bias in the short to medium term. Nifty continues to remain in an uptrend in the medium and long term, so buying on dips continues to be our preferred strategy.
The daily strength indicator RSI has turned positive from the oversold territory and is above its reference line indicating sustained uptrend.
The trend deciding level for the day is 15090. If NIFTY trades above this level then we may witness a further rally up to 15195-15310-15415 levels. However, if NIFTY trades below 15090 levels then we may see some profit booking initiating in the market, which may correct up to 14975-14865-14750 levels.
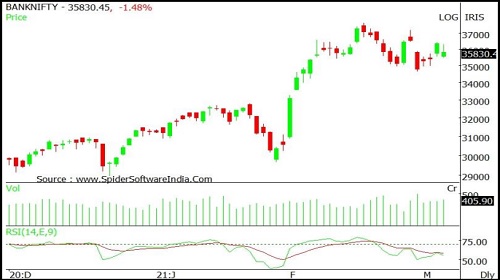
BANKNIFTY
Nifty opened with a downward gap and traded with extreme volatility on either side and witnessed profit booking at the end of the day. Banknifty closed at 35803 with a loss of 566 points.
On the daily chart the index has formed a small Bullish candle with upper shadow indicating selling pressure as well as resistance at higher levels. The index continues to move in a Higher Top and Higher Bottom formation on the hourly chart indicating positive bias. The chart pattern suggests that if Banknifty crosses and sustains above 36000 levels it would witness buying which would lead the index towards 36300-36800 levels. However if index breaks below 35700 level it would witness selling which would take the index towards 35400-35000. Banknifty is trading above 20 and 50 day SMA's indicating positive bias in the short to medium term. Banknifty continues to remain in an uptrend in the medium and long term, so buying on dips continues to be our preferred s trategy.
The daily strength indicator RSI has bounced from the 50 mark indicating change of momentum on the positive side.
The trend deciding level for the day is 35880. If BANK NIFTY trades above this level then we may witness a further rally up to 36240-36675-37035 levels. However, if BANK NIFTY trades below 35880 levels then we may see some profit booking initiating in the market, which may correct up to 35440-35080-34645 levels
To Read Complete Report & Disclaimer Click Here
For More Axis Securities Disclaimer https://simplehai.axisdirect.in/disclaimer-home
SEBI Registration number is INZ000161633
Views express by all participants are for information & academic purpose only. Kindly read disclaimer before referring below views. Click Here For Disclaimer


More News

Recent development of consecutive narrow ranged bodies with both the trend strength indicato...