Nifty has been consolidating in the range of 14800-14250 - ICICI Direct

Follow us Now on Telegram ! Get daily 10 - 12 important updates on Business, Finance and Investment. Join our Telegram Channel
Prolongation of consolidation amid stock specific action
Technical Outlook
* In line with our view, Nifty consolidated in the range of 14300- 14800 range throughout the week amid stock specific action. Despite Monday’s gap down opening index managed to hold the lower band of consolidation placed at 14250 and gradually recovered most of intraweek losses. As a result, weekly price action formed a high wave candle, indicating elevated volatility
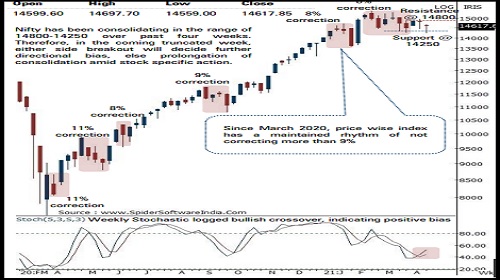
* Nifty has been consolidating in the range of 14800-14250 over past four weeks amid host of negative news flow related with COVID-19 2nd wave. Therefore, in the coming truncated week, either side breakout will decide further directional bias, else prolongation of consolidation amid stock specific action.
* On the sectoral front, Consumption, Pharma and Metals to relatively outperform while BFSI space has limited downsides thus offering favourable risk-reward setup • Amongst large caps, we prefer HDFC, Adani ports, Asian Paints, Tata Steel, Cipla, M&M, Titan while Infoedge, Mindtree, Astral Polytechnik, Bajaj electricals, Voltas, Balkrishna Inds, Escorts, Jindal Steel and Power, PI Industries, are expected to outperform in midcap space
* Key point to highlight since March 2020 is that Nifty midcap and small cap indices have maintained the rhythm of not correcting for more than average 9-10% while sustaining above their 50 days EMA, indicating robust price structure. Currently, broader market indices have undergone healthy profit booking after approaching their 52 weeks highs and corrected 7%, hauling both indices in the vicinity of their 50 days EMA, indicating temporary breather cannot be ruled out. However, such a breather should be capitalised on to accumulate quality stocks
* Structurally, we believe, any cool off from hereon would get anchored around key support threshold of 14250 which would offer incremental buying opportunity as 14250 is a confluence of:
* a) 61.8% retracement of the Feb rally (13596-15432), at 14297
* b) over past four weeks identical lows placed at 14250
* In the coming session, index is likely to witness gap down opening below Friday’s low (Spot 14559), indicating corrective bias. Hence, use intraday pullback towards 14560-14585 to create short for target of 14447.
NSE Nifty Weekly Candlestick Chart
Nifty Bank: 31977
Technical Outlook
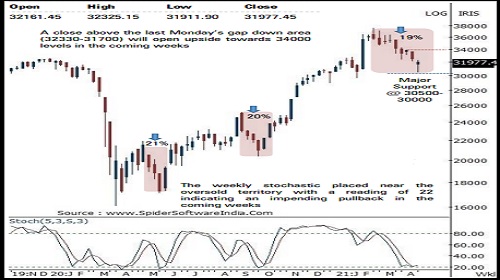
*The weekly price action formed a High wave candle with a small real body and a long lower shadow highlighting buying demand near the crucial support area of the 200 days EMA (currently at 29815 ) amid oversold placement of the weekly stochastic
*Going ahead, we expect volatility to remain high, however downsides to be limited in Banking index and eventually head towards 34000 levels in the coming month . Hence, one should accumulate quality stocks in the range of 32000 -30900 to ride next expected up leg
*Key point to highlight is , since March 2020 bottom, the index has a maintained rhythm of not correcting for more than 21 % . In the current scenario, with 19 % correction done, index is poised at crucial support and provides favourable risk -reward setup
*The index has strong support in the range of 30500 -30000 levels being the confluence of the following technical observations :
a) Price equality with the average of the previous two major correction in the last one year signals strong support around 30000 levels
b)The rising long term 200 days EMA is also placed around 29815
*The last nine weeks corrective decline has lead to the weekly stochastic placed near the oversold territory with a reading of 22 indicating an impending pullback in the coming weeks .
*In the coming session, the index is expected to open gap down . The immediate bias remain corrective as opening below Friday’s low (31985 ) . Hence after a negative opening use pullback towards 31780 -31840 for creating short position for the target of 31560 , maintain a stoploss of 31940
Nifty Bank Index – Weekly Candlestick Chart
To Read Complete Report & Disclaimer Click Here
https://secure.icicidirect.com/Content/StaticData/Disclaimer.html
Views express by all participants are for information & academic purpose only. Kindly read disclaimer before referring below views. Click Here For Disclaimer




Tag News

Stock Picks : TCS Ltd And Chambal Fertiliser Ltd By ICICI Direct


