NIFTY forms DOJI candle pattern on the weekly charts - GEPL Capital

Follow us Now on Telegram ! Get daily 10 - 12 important updates on Business, Finance and Investment. Join our Telegram Channel
Key Highlights:
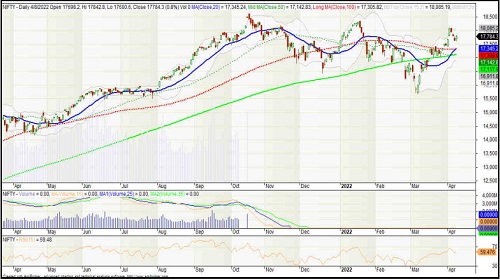
NIFTY forms DOJI candle pattern on the weekly charts.…
NIFTY SPOT: 17784.35 (0.82%)
TRADING ZONE:
Resistance: 17842 (Day High) / 18000 (Key Resistance)
Support: 17700 (Key Support) / 17600 (Day Low)
BROADER MARKET: Inline
MIDCAP 150: 11666.85 (0.94%), SMALLCAP 250: 9934.75 (0.77%)
Advance-Decline: 1453 / 645
VIEW: Bullish till above 17450 (Key Support).
BANKNIFTY SPOT: 37752.05 (0.52%)
TRADING ZONE:
Resistance: 37975 (3 Day High)/ 38250 (Key Resistance)
Support: 37346 (3 Day Low) / 36816 (200 Day SMA)
VIEW: Bullish above 36816 (200 Day SMA)
Technical Snapshot

To Read Complete Report & Disclaimer Click Here
SEBI Registration number is INH000000081.
Please refer disclaimer at https://geplcapital.com/term-disclaimer
Above views are of the author and not of the website kindly read disclaimer


 320-x-100_uti_gold.jpg" alt="Advertisement">


