Index to form base around the key support area of 15600-15400 - ICICI Direct

Follow us Now on Telegram ! Get daily 10 - 12 important updates on Business, Finance and Investment. Join our Telegram Channel
Nifty
Index to form base around the key support area of 15600-15400
Day that was…
Equity benchmarks slumped over fifth week on the trot tracking weak global cues owing to rate hike and inflation worries. The Nifty ended the volatile week at 15782, down 3.8%. Broader markets indices relatively underperformed the benchmark as Nifty midcap and small cap lost 5% and 8%, respectively. Sectorally, all major indices ended in red weighed by metal, PSU Bank, Realty underperformed
Technical Outlook
• On fifth consecutive occasion index started the week with a negative gap and inched southward. As a result, weekly price action formed a sizable bear candle carrying lower high-low, indicating continuance of corrective bias
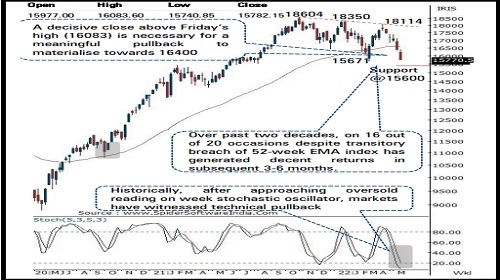
• Going forward, a follow through strength along with a decisive close above Friday’s high (16083) is necessary for a meaningful pullback to materialise towards 16400 from current oversold reading. Failure to do so would lead to prolongation of corrective bias wherein key support is placed at 15600-15400 zone which is 61.8% retracement of CY21 rally coincided with equality of previous down leg of 14%
• In the coming week, cool off in VIX (that gauge the market sentiment) and commodities which will indicate improving market sentiment and has inverse correlation with equity indices. On the upside 16400 would be the key level to watch as it is 38.2% retracement of past four weeks decline (17414-15735)
• Historically, over past two decades, on 16 out of 20 occasions despite transitory breach (not greater than 5%) of 52-week EMA (currently 16600) index has generated decent returns in subsequent 3 month and 6 months. In current scenario 5% from 200 days EMA will mature at 15700. Meanwhile, past four weeks corrective move hauled daily and weekly stochastic oscillator in extreme oversold territory (currently placed at 12 and 8). Historically, after approaching such lower reading, markets have witnessed technical pullback. Although the short term trend remains down, structurally ongoing secondary correction is part of a retracement of CY20-21 rally. Hence, investors should use current weakness to their advantage and focus on constructing portfolios of quality companies in staggered manner.
• Sectorally, IT, Auto, Telecom, Hospitality are priced with favourable riskreward. We advise to accumulate quality stocks in a staggered manner from medium term perspective • In large caps, we prefer TCS, Reliance industries, Tata Motors, Titan while in midcaps we prefer ABB, Indian Hotels, Inox Leisure, Apollo Tyres, Greaves Cotton, Gokaldas Exports and Mahindra CIE
• The broader market indices continued to underperform with lower highlow formation. Past five weeks corrective move hauled weekly stochastic oscillator in extreme oversold territory, indicating impending pullback. However, formation of higher high-low on the closing basis would be required to confirm the pause in downward momentum, else extended correction. In the coming session, index is likely to open on a flat to positive note tracking positive global cues. We expect buying demand to emerge around the March low (15671). Hence after a positive opening use dips towards 15690-15722 for creating long position for the target of 15807
Nifty Bank: 33121
Day that was :
The Bank Nifty declined for the fifth consecutive week and closed sharply lower by 4 % during previous week amid weak global cues owing to rate hike and inflation worries . The decline was broad based as both PSU and private banking stocks witnessed sharp decline . The Bank Nifty closed the week at 33121 levels down by 1470 points or 4.2% on weekly basis
Technical Outlook
• The weekly price action formed a sizable bear candle with a lower high -low as it closed below the immediate support area of 34000 -33800 signaling continuation of the corrective decline .
• Going ahead, index need to start forming higher high -low in the daily chart on a sustained basis for any technical pullback to materialize towards 35000 levels . Failure to do so will keep the immediate bias down and extend the current corrective decline towards the March low (32155 )
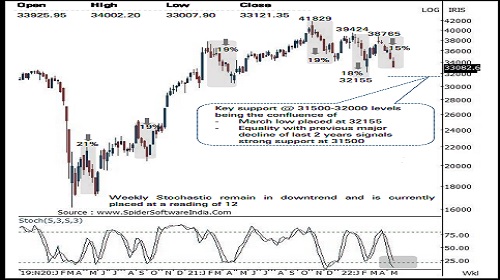
• On the higher side the Index has stiff hurdle around 35000 levels being the confluence of the bearish gap area of 6th May 2022 and the 38 . 2 % retracement of current decline (38765 -33927 )
• The index has support around 31500 -32000 levels as it is confluence of
• (a) March low placed at 32155
• (b) Equality with previous major decline of last 2 years signals support at 31500 levels
• Among the oscillators the weekly stochastic is placed at an oversold territory however it continues to remain in downtrend and is currently placed at reading of 11
In the coming session, index is likely to open on a flat to positive amid positive global cues . We expect the index to trade in a range with positive bias . Hence after a positive opening use intraday dips towards 32900 -32980 for creating long position for the target of 33230 , maintain a stoploss at 32780
To Read Complete Report & Disclaimer Click Here
https://secure.icicidirect.com/Content/StaticData/Disclaimer.html
Above views are of the author and not of the website kindly read disclaimer


Tag News

Stock Picks : TCS Ltd And Chambal Fertiliser Ltd By ICICI Direct