Home First Q1 FY24 Financial Results

Key Performance Indicators for Q1 FY24

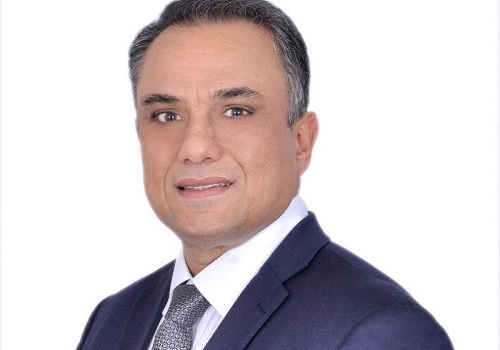
Commenting on the performance Mr.Manoj Viswanathan, MD & CEO said,
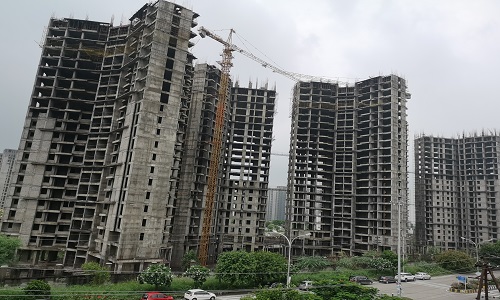
“We stay focused on providing loans for affordable housing, led by distribution and use of technology, backed by diversified funding and strong risk management. We continue to expand our distribution in large affordable housing markets in States where we are already present, going deeper in a contiguous manner. We now do business across 282 touchpoints across Tier 1, Tier 2 and Tier 3 markets in 13 states/ UT. Disbursement in Q1 at Rs 895 Cr was higher than Q4, with a growth of 35.4% on y-o-y basis and 3.0% on q-o-q basis, leading to an AUM growth of 33.3% to Rs 7,776 Cr. We witnessed pass through of rate hikes and elevated interest rate environment. Our strong liability profile and timely availability of low cost funding from NHB enabled us to contain the cost of borrowing. Competitive overall cost of borrowing coupled with PLR increase of 50bps in Apr’23 helped expand spreads on q-o-q basis and sustain NIM on q-o-q basis, despite increase in leverage. Spreads at 5.7% remain ahead of our guided levels of 5.25%.
Asset quality is at pre-covid levels and reflects marginal seasonality impact in Q1FY24
* 1+ DPD increased from 4.0% in Q4 to 4.3% in Q1 but showed a yoy decrease of 70 bps.
* 30+ DPD increased from 2.7% in Q4 to 2.9% in Q1 but showed a yoy decrease of 60 bps.
* Gross Stage 3 (GNPA) is stable qoq at 1.6% but showing a yoy decline of 50 bps. Prior to RBI classification circular of Nov’21, it stands at 1.0% up 10 bps from Q4.
* Our credit cost is at 40bps for the quarter.
PAT at Rs. 69 Cr was up 34.9% y-o-y and 8% q-o-q. ROA holds steady at 3.9%. Q1FY24 ROE at 15% (+220 bps y-o-y, +60 bps q-o-q) is a testimony of our strong and agile business model.
Digital adoption continues to be strong and an key area of our focus as we grow. 93% of our customers are registered on our app as on Jun’23. Unique User Logins was 55% in Q1FY24. Service requests raised on app was stable at 91%.
We believe that given the tailwinds of the housing sector supported by overall economic growth momentum and strong execution mindset of the company we will continue to deliver excellent results while staying true to our mission of being the “Fastest Provider of Home Finance for the Aspiring Middle Class, delivered with Ease and Transparency
Key Highlights for Q1 FY24:
Distribution:
* The Company has 113 branches with presence in 13 States / UT (+2 from Mar’23).
* Total touchpoints increased to 282 (+17 from Mar’23 and +58 from Jun’22).
Q1 Disbursements:
* Disbursements of INR 895 Crs in Q1, y-o-y growth of 35.4% and 3.0% on q-o-q basis
Asset under Management (AUM) :
* INR 7,776 Crs, growth of 33.3% on y-o-y basis and 8% q-o-q basis.
* Focus on housing loans that contribute 87% of AUM and EWS / LIG category that forms ~67% of the customer base.
Asset Quality:
* Bounce rates increased to 15.0% from 13.6% in Q4 FY23.
* 1+ DPD increased to 4.3% from 4.0% on q-o-q basis (decrease from 5% y-o-y).
* 30+ DPD increased to 2.9% from 2.7% on q-o-q basis (decrease from 3.5% y-o-y).
* Gross Stage 3 (GNPA) in line with RBI circular dated 12 Nov 2021, is stable at 1.6% on q-o-q basis (decrease from 2.1% y-o-y).
* Prior to such classification it stands at 1.0% in Jun’23 (decrease from 1.2% on y-o-y basis)
Provisions:
* ECL provision as on Jun’23 is INR 62 Crs; resulting in total provision to loans outstanding ratio at 0.9%; and the GNPA total provision coverage ratio (PCR) is at 57.1% in Jun’23 vs 45.8% in Jun’22 (total PCR without considering the impact of RBI circular is 90.8% in Jun’23 vs 81.0% in Jun’22).
Borrowings:
* Total borrowings including debt securities are at INR 5,626 Crs as on Jun’23 up from INR 3,780 Crs as on Jun’22. The company continues to carry a liquidity of INR 2,092 Crs as on Jun’23.
* Cost of borrowings at 8.0% in Q1FY24, increased by 10 bps compared to 7.9% in Q4FY23
Spread:
Spread on loans stood at 5.7% in Q1FY24, increase of 20bps over Q4FY23.
Capital Adequacy:
* Total CRAR at 46.0%. Tier I capital stands at 45.5% as on Jun’23.
* Networth as on Jun’23 is at INR 1,868 Crs vis-à-vis INR. 1,817 Crs as on Mar’23
Q1FY24 Financial Performance:
* Total Income at INR 260 Crs; y-o-y growth of 53.4%.
* PPOP stands at INR 98 Crs, growth of 39.8% on y-o-y basis.
* PAT at INR 69 Crs, up by 34.9% from INR 51 Crs in Q1FY23.
* ROA at 3.9% stable on y-o-y & q-o-q basis.
* ROE at 15.0% increased by 60bps on q-o-q and 220bps on y-o-y basis
Above views are of the author and not of the website kindly read disclaimer