Geopolitical News to Drive Forex Markets in Holiday Shorten Week - HDFC Securities

Follow us Now on Telegram ! Get daily 10 - 12 important updates on Business, Finance and Investment. Join our Telegram Channel
Geopolitical News to Drive Forex Markets in Holiday Shorten Week - HDFC Securities
Indian rupee in line with regional currencies weakened against US dollar. Safe haven currencies and commodities gained following Russia’s war on Ukraine predictably whipsawed markets last week. Surge in crude oil and gold prices, weaker equities, higher inflation and foreign fund outflows weighed on rupee. Brent crude topping $105 a barrel and gold made high of $1975/ounce, both accounts major chunk of India imports which could widen India’s deficit.
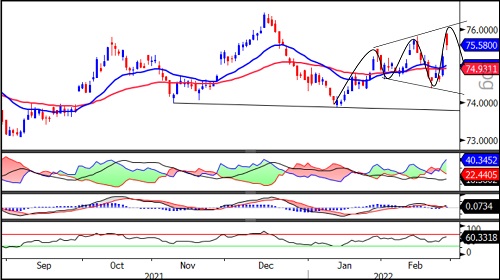
Spot USDINR gained 63 paise or 0.84% to 75.29. Technically, the pair has been trading in broadening triangle with higher highs and lower lows which normally snares breakout traders. We believe the pair has been in broad consolidation range of 76 to 74 that a swing traders can best use it.
India’s foreign exchange (forex) reserves rose by $2.762 billion to $632.952 billion for the week ended February 18, led by revaluation of dollar and gold, the RBI data showed
Coming week will be holiday shorted with series of economic data at domestic and global front. Volatility expected to remain high following geopolitical worries
The bulls got the last laugh in a wild week, as risk assets claw back into positive territory on Friday as Fed’s 50bps rate hike probability declined after geopolitical worries mountain on Thursday after Russia attached on Ukraine. The Fed reiterated its view that it will “soon” be time to raise rates. Markets still see around six quarter-point increases by the Fed in 2022. A prolonged war could deliver a blow to the global economy and slow the normalization of central bank policy
USDINR
Technical Observations:
USDINR March futures formed expanding triangle pattern with higher highs and lower lows. The swing highs and lows usually false breakout and breakdown signal in broadening triangle patterns.
The pair is also oscillating with 3% standard deviation to 21 days simple moving average.
Momentum oscillators, (RSI) Relative Strength Index of 14 days sustained above 50 and heading north indicating upward momentum.
On account of monthly expiry, we have seen long roll over with rise in price, volume and open interest.
Considering broadening triangle pattern formation in mind there could be seven to nine swing we believe, USDINR may form down swing in coming days with lower side support around 74.30 and resistance at 76.

EURINR
Technical Observations:
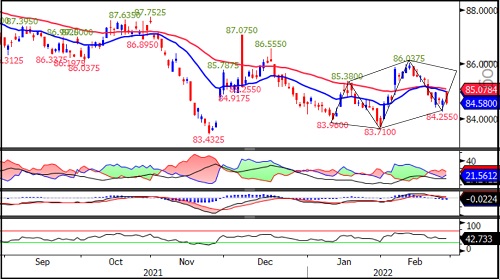
EURINR March futures forming Diamond pattern on daily chart considered as one of the consolidation pattern. The breakout of the pattern comes above 86 while falling below 84.25 indicate continuation of down trend
The par has formed higher high and low on daily chart but floating below short term and medium term moving averages indicating medium term down trend.
Momentum oscillator, Relative Strength Index of 14 days has been flattening below 50 indicating consolidation
Looking at the over chart patterns, the pair is expected to trade with in broad range of 86 to 83.70.
EURINR March futures likely to trade volatile with in range with higher side resistance at 86 and support at 83.70.

GBPINR
Technical Observations:
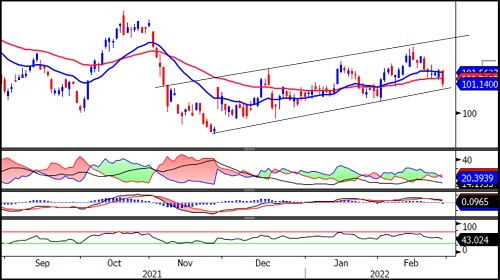
GBPINR March futures has been trading in ascending channel with higher top higher bottom since start of the November 2020. The pattern is considered to be bullish patter as long as it holds the support of lower upward slopping trend line which is currently placed around 101.
The pair has been placed below short and medium term moving averages.
Directional Movement index indicating consolidation in price as gap between – DI and +DI are narrowed while ADX line has been placed below breakeven line.
Momentum oscillator, RSI has been placed below 50 level and weakening.
GBPINR March futures expected to fine support around 101 but in case it fails to hold we could see escalation selling while on higher side it may find resistance around 103 odd levels.

JPYINR
Technical Observations:
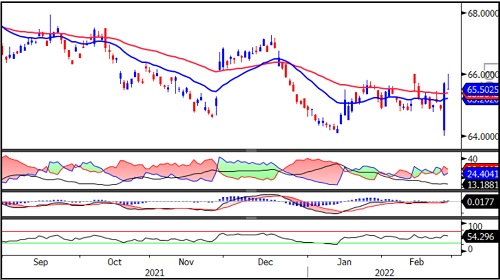
JPYINR March futures formed Bearish Gravestone Doji Candlestick patterns on Friday indicating bearishness. Recently, the pair unable to cross the 66 level and made yearly low this week indicating inherent weakness.
The pair has been oscillating around 55 days exponential moving average
Momentum oscillator, Relative strength index has been oscillating placed above 50 but weakening.
MACD has been placed above zero line with positive cross over but histogram bar small indicating weaker trend.
Directional movement index is indicating weak bias as –DI is placed above +DI and ADX line weakening.
JPYINR March futures expected to trade within range of 66 to 64 with weak bias until it crosses 66.

To Read Complete Report & Disclaimer Click Here
Please refer disclaimer at https://www.hdfcsec.com/article/disclaimer-1795
SEBI Registration number is INZ000171337
Views express by all participants are for information & academic purpose only. Kindly read disclaimer before referring below views. Click Here For Disclaimer


Tag News

EURINR trading range for the day is 89.13 - 89.49. - Kedia Advisory


 320-x-100_uti_gold.jpg" alt="Advertisement">


