320-x-100_uti_gold.jpg" alt="Advertisement">

Copper, Natural Gas, Silver and Zinc Commodity Report Of 03/02/2021 By - Enrich Commodities

Follow us Now on Telegram ! Get daily 10 - 12 important updates on Business, Finance and Investment. Join our Telegram Channel
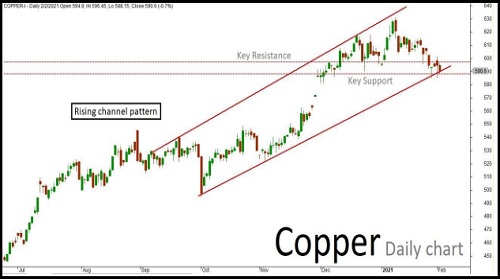
COPPER
Technical outlook
Copper Feb future daily chart has formed "Rising channel" pattern. The last few sessions ended up sideways mode along with some corrections inside the channel. The market is still expected to continue on bearish momentum based on the current price action, once the same break below the key support holding near 588. The downside rally could be testing all the way up to 585-582 levels in the upcoming sessions. Alternatively, if the market struggles to break the support level, then it might revise the trend to bullish/sideways mode. Key resistance holds at 597
Technical Chart
To Read Complete Report & Disclaimer Click Here
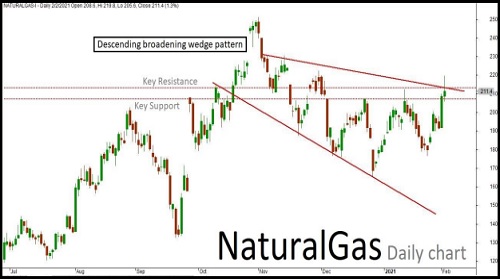
NATURAL GAS
Technical outlook
Natural gas daily chart has formed “Descending broadening wedge” pattern. The last few sessions ended up sideways mode along with some corrections inside the channel. The market is expected to continue on the bullish momentum based on the price action, once break above a key resistance holding near 213. The upside rally could be testing all the way through 216-219 levels in the upcoming sessions. Alternatively, if the market struggles to break the resistance level, then it might retest the same and turn bearish/sideways once again. Key support holds at 207. A slide to 204 is also a possibility if the price makes or break below the current support level.
Technical Chart
To Read Complete Report & Disclaimer Click Here
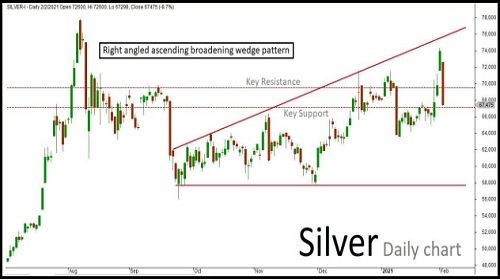
SILVER
Technical outlook
MCX Silver March futures technical chart has taken the formation of "Right angled ascending broadening wedge" pattern in daily time frame. Last few sessions ended up in sideways mode along with some corrections inside the channel. The market is expected to continue on bearish momentum based on the current price action, once the same break below the key support level holding near 67100. The downside rally could be extending all the way up to 66300-65500 levels in the upcoming sessions. An alternative scenario indicates that if the market struggles to break the support level, then it might retest the same and revise the trend to bullish/sideways mode once again. Key resistance holds near 69500
Technical Chart
To Read Complete Report & Disclaimer Click Here
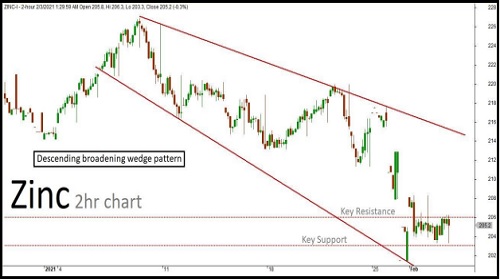
Zinc
Technical outlook
Zinc Feb future 2hr Chart has formed "Descending broadening wedge" pattern. The last few sessions ended up sideways mode after retesting near the channel’s support line. The market is expected to continue on the bullish term based on the current price action, once the same breaks above a key resistance holding near 206. The upside rally could be testing all the way up to 207.50-209 levels in the upcoming sessions. Alternatively, if the market struggles to break the resistance level, then it might retest the same and revise the trend to bearish/sideways. Key support holds at 203. A slide to 201.50 is also a possibility if the price makes or break below the current support level.
Technical Chart
To Read Complete Report & Disclaimer Click Here
Please refer disclaimer at https://enrichbroking.in/disclaimer
SEBI Registration number is INZ000078632
Views express by all participants are for information & academic purpose only. Kindly read disclaimer before referring below views. Click Here For Disclaimer