320-x-100_uti_gold.jpg" alt="Advertisement">

All Eyes will be on Jackson Hole Symposium - HDFC Securities

Follow us Now on Telegram ! Get daily 10 - 12 important updates on Business, Finance and Investment. Join our Telegram Channel
All Eyes will be on Jackson Hole Symposium - HDFC Securities
Indian rupee depreciated 15 paise to 74.39 in line with broader weakness in Asian currencies after a sharp rise in dollar index as FOMC minutes highlighted the openness of Fed members to evaluate tapering this year itself. Fed Minutes may not have clarified when the Fed is going to implement taper, but it definitely indicated that most policymakers would prefer that it be underway soon. On other hand, Virus spread is back in news again. New variant of covid19 has been seen even after having been vaccinated twice is challenging the confidence of pandemic ending any time soon.
Along with other peer currencies, rupee is also expected to trade in range ahead of crucial Jackson Hole symposium. Volatility could back in market with taper talk and portfolio rebalancing after surge in risk assets.
Spot USDINR is struggling for direction in absence of new triggers. The pair is trying to take cues from stronger dollar but fund inflows and lower crude oil prices dragging it lower. From the level perspective, we believe USDINR could swing within the range of 74.60 to 74.10
The dollar is being driven higher by the combined forces of a Fed moving towards a taper and the re-assessment of global growth prospects on the back of the Delta Variant. Now the focus will be on Jackson Hole symposium over Thursday and Friday after FOMC meeting minutes stating hawkishness. Most expect the Fed to shed light on its tapering decision, which could be announced as early as September and started in October.
Expecting the dollar to stay in demand ahead of the Jackson Hole event risk. The data docket from US remain full with the August PMI reading, July home sales data, 2Q GDP revisions and 2Q personal consumption data, all of which should be over-shadowed by the Jackson Hole event.
USDINR
Technical Observations:
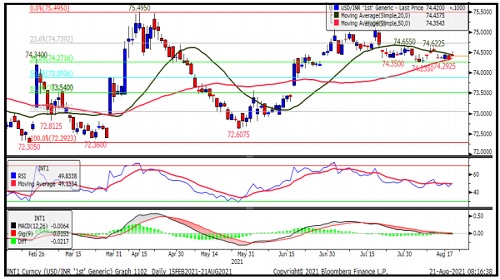
USDINR has formed Gravestone Doji Candlestick on Friday pattern indicating bearish momentum. Small body and shadow on last two weekly candle suggesting consolidation.
The gap between 20 and 50 days simple moving average has been narrowed down and about to give negative cross over indicating near term consolidation
The pair is continuing with bearish chart formation of lower top lower bottom. It has been stuck in the range of 74.66 to 74.23 (As shown in side chart).
Momentum oscillator, RSI of 14 days is placed sub 50 indicating consolidation.
While MACD placed near zero line and histogram is flat lacking the clear direction.
USDINR August futures is expected to consolidate in the range of 74.70 to 74.20 before heading towards April high.
USDINR August Futures Daily Chart
EURINR
Technical Observations:
EURINR August futures plunged below 87 level and heading towards 74.6% retracement level placed at 86.61.
The pair has been resisting at 50 days simple moving average since start of June, which is currently placed at 88.29.
Near term resistance is placed at 87.83, the 20 days simple moving average.
It has been in bearish chart formation of lower top lower bottom on daily and weekly chart indicating down trend.
Momentum oscillator, Relative Strength Index (RSI) of 14 days period heading south and currently placed at 31 suggesting continuation of bearish momentum.
EURINR August futures expected to show short covering bounce in coming days but the trend remains bearish until it crosses the level of 88.90. One can expect level of 86 in coming month.
EURINR August Futures Daily Chart

GBPINR
Technical Observations:
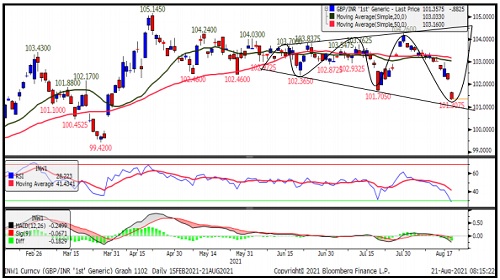
GBPINR August futures broken the previous bottom support at 101.70 with gap down suggesting bearish trend
The pair has been forming expanding triangle with higher highs and lower lows on daily chart. The pair has support around 101 and resistance around 104.60.
Momentum oscillator, relative strength index (RSI) of 14 days period entered in oversold zone and the gap between average and RSI widened suggesting bearishness
MACD and MACD histograms of 12 and 26 are placed below zero line with negative cross over indicating bearish trend.
MACD and MACD histograms of 12 and 26 are placed below zero line with negative cross over indicating bearish trend.
GBPINR August Futures Daily Chart
JPYINR
Technical Observations:
JPYINR August futures swinging around 20 days simple moving average by holding the support 50 days simple moving average.
The pair has been forming lower top lower bottom on daily chart within narrow range. Medium term trend remains bearish while multiple bottom around 66.20 could act as strong support, for reversal it need to sustain above 68.60 level.
Momentum oscillator, relative strength index of 14 days period is placed above 50 with positive cross over, could be mildly positive for the pair.
MACD is placed near zero line with negative cross over and histogram is flatten around zero line indicating consolidation in pair.
JPYINR August futures expected to trade with negative bias and could touch level of 66.80 in coming days. The said view will be negated it starts trading above 68.30
JPYINR August Futures Daily Chart

To Read Complete Report & Disclaimer Click Here
Please refer disclaimer at https://www.hdfcsec.com/article/disclaimer-1795
SEBI Registration number is INZ000171337
Views express by all participants are for information & academic purpose only. Kindly read disclaimer before referring below views. Click Here For Disclaimer


Tag News

EURINR trading range for the day is 89.13 - 89.49. - Kedia Advisory


More News

GBPINR is consolidating where 100.80-101 are immediate resistance level - Swastika Investmar...