India Remains Resilient Amid Global Shocks; Valuation Reset and Domestic Participation Strengthen Long-Term Investment Case: PL Asset Management

PL Asset Management, the asset management arm of PL Capital Group has released its PMS Monthly Newsletter for May 2026, reporting that Indian markets successfully navigated one of the most challenging external environments in recent years.
May 2026 was defined by two contrasting global narratives. Global investors concentrated capital into AI and semiconductor-led markets in the US, South Korea and Taiwan — US hyperscalers committed ~$725 billion in 2026 AI capex, up 77% year-on-year — while India absorbed a series of external shocks: Brent crude spiking to $114 per barrel, the rupee hitting a record low of ?96.97, and WPI inflation rising to a 3.5-year high of 8.3%. Crude moderated to $87.76 by end-May on ceasefire hopes, easing the immediate pressure.
Despite these headwinds, the Nifty Midcap 150 rose 2.60% and the Nifty Smallcap 250 advanced 1.56% even as the Nifty 50 declined 1.87%, reflecting continued domestic investor confidence.
|
Index |
1M |
3M |
6M |
12M |
|
Nifty 50 |
−1.87% |
−6.48% |
−10.13% |
−5.18% |
|
Nifty 500 |
−0.12% |
−2.20% |
−5.33% |
−0.89% |
|
Nifty Mid Cap 150 |
+2.60% |
+3.31% |
+0.79% |
+6.65% |
|
Nifty Small Cap 250 |
+1.56% |
+7.00% |
+1.55% |
+1.27% |
Source: PL Capital | Data till 31 May 2026
Domestic Institutions Anchor the Market
FIIs withdrew approximately ?55,963 crore from Indian markets in May — their 11th consecutive month of net selling. DIIs invested ?82,668 crore in response, more than covering every rupee of foreign outflows. Cumulative DII purchases in CY2026 crossed ?4.16 lakh crore, lifting domestic ownership to a record 18.9% while FII ownership fell to 14.7%, the lowest since June 2012. PL Asset Management describes this as a structural transformation, with domestic investors increasingly acting as a stabilizing force during periods of global uncertainty.
Earnings Strength Supports Market Breadth
Q4FY26 corporate PAT grew approximately 17% year-on-year. Mid-caps led at nearly 29% growth. Metals & Mining posted 30.2%, Electric Utilities 26.5%, and Oil, Gas & Fuels 26.9%. Crucially, 21 of 29 tracked sectors delivered double-digit earnings growth — a structural contrast with AI-heavy global markets where two to three companies drive index-level earnings.
|
Sector |
Q4FY26 PAT Growth YoY |
1M Return |
|
Metals & Mining |
+30.2% |
+4.74% |
|
Oil, Gas & Fuels |
+26.9% |
−4.23% |
|
Electric Utilities |
+26.5% |
+0.26% |
|
Automobiles & Components |
+16.1% |
+1.62% |
|
Nifty 500 Index (Overall) |
+14.3% |
−0.12% |
|
Banks |
+10.4% |
−1.14% |
Source: Kotak Institutional Equities, Q4FY26 Earnings Review, June 9, 2026 | Index returns: PL Capital
Macroeconomic Indicators Remain Supportive
|
7.8% Q4FY26 GDP (est. 7.2%) |
59.3 Composite PMI — 6-mth high |
3.48% CPI — within RBI band |
−11% Nifty PE vs 5Y mean |
Q4FY26 GDP grew 7.8%, above consensus of 7.2%, with private investment up 10.8% year-on-year. Composite PMI reached a six-month high of 59.3. CPI inflation came in at 3.48%, within the RBI’s 2–6% band. The RBI held the repo rate at 5.25% at its June 5 meeting — the third consecutive hold after 125 bps of cuts since February 2025. Nifty valuations have reset to approximately 11% below the five-year mean, the most attractive entry point in several years.
FUND MANAGER’S PERSPECTIVE
Siddharth Vora, Fund Manager & Head of Asset Management, PL Capital
Fund Manager’s View
“Global equity leadership has become increasingly concentrated in AI and semiconductor-heavy markets. In May, South Korea gained 28.45%, Taiwan 14.92% and the Nasdaq 100 10.49%, reflecting strong earnings momentum and unprecedented AI investment. However, this strength is now highly concentrated: the top five stocks account for nearly 70% of the Korean index and about 60% of Taiwan’s market, with Samsung and SK Hynix contributing roughly 45% in Korea and TSMC alone representing nearly 42% in Taiwan. This concentration has amplified returns, but it also increases sensitivity to any moderation in AI capex, memory pricing or earnings expectations.
Valuations and price momentum also indicate that expectations are elevated. South Korea is trading around 5.9 standard deviations above its five-year average P/E and nearly 50% above its 200-day moving average, while Taiwan is around 2.9 standard deviations above its historical valuation and over 35% above its 200-day average. These are genuine growth markets, but the margin for disappointment has narrowed materially.
India offers a more diversified setup. The Indian market is spread across financials, consumption, industrials, healthcare, energy, technology and domestic cyclicals, rather than being dependent on one or two companies. In Q4FY26, the Nifty 500 delivered 14.3% year-on-year profit growth, with 21 of 29 sectors reporting double-digit earnings growth. At the same time, India’s valuation has normalised to below its five-year average, and the market remains below its 200-day moving average, suggesting that much of the earlier premium has already corrected.
The possible outcomes are therefore asymmetric. If AI growth broadens, India can participate through technology services, manufacturing and enterprise adoption. If the AI trade cools gradually, global flows may rotate toward diversified markets with improving earnings breadth. In a sharper correction, India would not be immune, but its lower concentration, domestic liquidity and broader earnings base could offer relative resilience.
India does not need to replace the AI trade. Its opportunity lies in becoming more valuable as global investors begin to favour breadth over concentration.”
— Siddharth Vora, Head of Investments, PL Asset Management
Global Valuation Scorecard — India vs AI-Heavy Markets
|
Market |
Current P/E |
5Y Avg P/E |
P/E Deviation (σ) |
vs 200-Day MA |
Mkt Cap / GDP |
|
South Korea |
18.24x |
10.54x |
+5.87σ |
+50.10% |
~244% |
|
Taiwan |
23.61x |
16.20x |
+2.88σ |
+35.73% |
~490% |
|
Japan |
18.13x |
14.87x |
+2.22σ |
+4.87% |
~192% |
|
S&P 500 |
26.20x |
23.22x |
+0.90σ |
+6.00% |
~207% |
|
Nasdaq 100 |
30.86x |
30.27x |
+0.20σ |
+11.40% |
~118% |
|
India ? |
22.44x |
23.10x |
−0.53σ |
−8.44% |
~102% |

P/E data: PL Capital research | Data as of May–June 2026
STRATEGY UPDATE — AQUA PMS
AQUA: +2.82% in May; 9 of 12 Quarters of Outperformance Since Inception
PL Asset Management’s flagship AQUA (Adaptive Quantitative Unbiased Alpha) strategy returned +2.82% in May against the BSE 500 TRI’s −0.17%, generating ~300 bps of alpha. The strategy has outperformed its benchmark in 9 of 12 quarters since inception (12 June 2023), compounding at 20.90% per annum versus 13.33% for the benchmark — an annualised alpha of 7.57%.
|
+2.82% AQUA — May 2026 |
−0.17% BSE 500 TRI |
20.90% Since-inception CAGR (pa) |
+7.57% Annualised alpha — inception |
0.78 Sharpe Ratio |
May outperformance was driven by four factors: (1) A significant overweight in Materials (26% vs ~8% benchmark) and Automobiles (13% vs ~8%) captured gains from VEDL (+29.85%), MOTHERSON (+20.24%) and SOLARINDS (+18.19%). (2) Underweights in Financials (16% vs ~26%) and IT (2% vs ~7%) shielded the portfolio as Bank Nifty fell −1.14% and IT −0.93%. (3) Factor alignment toward High Beta (+4.41%) and Momentum (+2.52%) in a month that rewarded stock-pickers. (4) An 8% cash buffer maintained for high-conviction deployment.
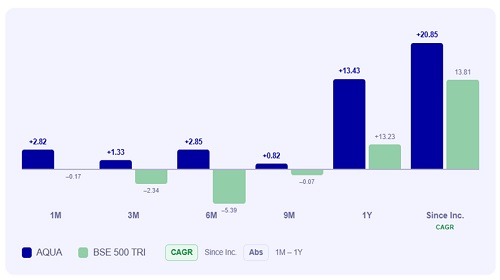
*AQUA inception date 12 June 2023; 3-Year CAGR not yet applicable. †Q1 FY2026–27 as of 31 May 2026. Returns net of expenses, fees and costs. Source: PL Capital
STRATEGY UPDATE — MADP
MADP: +1.83% in May vs Benchmark +0.13%; 3-Year CAGR 14.91% pa
The Multi Asset Dynamic Portfolio (MADP), PL Asset Management’s all-weather open-ended strategy, returned +1.83% in May 2026, outperforming the Nifty Multi Asset Index (+0.13%) by 170 bps. Gold at 28% of the portfolio was the key stabiliser: GOLDBEES returned +4.23% while equities faced pressure — precisely the behaviour a multi-asset strategy is designed to produce.
|
+1.83% MADP — May 2026 |
+0.13% Nifty Multi Asset Index |
14.91% 3-Year CAGR (pa) |
+3.21% 3-Year annualised alpha |
0.71 Sharpe Ratio |
Over three years, MADP has compounded at 14.91% per annum against 11.70% for its benchmark, with lower volatility (12.25% annualised standard deviation) than the Nifty 500 (14.16%) and gold standalone (22.29%), and a maximum drawdown of −14.60%. For Q1 FY2026–27 to date, MADP returned 11.10% versus the benchmark’s 5.79%.
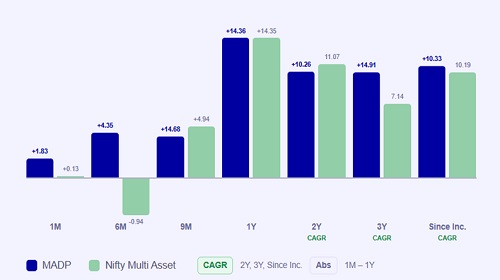
*Q1 FY2026–27 as of 31 May 2026. Inception: 7 June 2021. Returns net of expenses, fees and costs. Source: PL Capital
OUTLOOK
Stay Invested: India’s Moment Is Building
PL Asset Management remains constructive on Indian equities over the medium to long term. While external risks — including geopolitical developments, oil price movements, monsoon outcomes and global capital flows — will continue to influence near-term sentiment, the firm believes India’s improving valuation profile, resilient earnings growth, strong domestic participation and favourable macroeconomic fundamentals provide a solid foundation for long-term wealth creation.
Three macro headwinds are moving in a more constructive direction: the rupee appears to be stabilising post the record-low of ?96.97, crude oil has moderated from the $114 spike, and market valuations have reset from earlier elevated zones. Together, this reduces pressure on inflation, the current account, currency stability and foreign investor sentiment.
The firm continues to favour opportunities linked to domestic consumption, financials, manufacturing, industrials, healthcare and select mid-cap businesses well positioned to benefit from India’s next phase of economic growth. Key near-term watchpoints include the monsoon (forecast below normal with 60% probability of deficiency), crude oil (any sustained move above $100 would restart the CAD-rupee-inflation chain), and RBI policy direction.