The Bank Nifty trend deciding level for the day is 33980 - Axis Securities

Follow us Now on Telegram ! Get daily 10 - 12 important updates on Business, Finance and Investment. Join our Telegram Channel
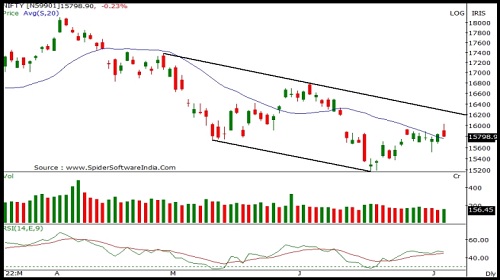
Nifty
Nifty opened on a positive note and extended buying momentum in the initial hour however selling pressure at higher levels dragged index lower to close near the day's low. Nifty closed at 15811 with a loss of 25 points. On the daily chart the index has formed a bearish candle with a long upper shadow indicating selling pressure as well as resistance at higher levels. The index is moving in a Higher Top and Higher Bottom formation on the daily chart indicating an uptrend. The chart pattern suggests that if Nifty crosses and sustains above 15900 levels it would witness buying which would lead the index towards 16000-16200 levels. However if the index breaks below 15700 level it would witness selling which would take the index towards 15600-15500. Nifty is trading above its 20 day SMA which indicates positive bias in the short term. Nifty continues to remain in a downtrend in the medium term, so selling on rallies continues to be our preferred strategy. The daily strength indicator RSI has turned positive from the oversold territory and is above its reference line indicating positive bias. The trend deciding level for the day is 15875. If NIFTY trades above this level then we may witness a further rally up to 15965-16115-16205 levels. However, if NIFTY trades below 15875 levels then we may see some profit booking initiating in the market, which may correct up to 15720-15635-15480 levels.
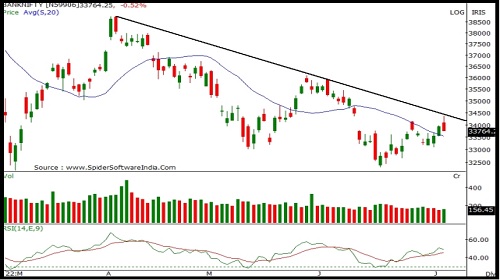
Bank Nifty
Banknifty opened on a positive note and extended buying momentum in the initial hour however selling pressure at higher levels led the index to close near the day's low. Banknifty closed at 33816 with a loss of 125 points. On the daily chart the index has formed a bearish candle with a long upper shadow indicating selling pressure as well as resistance at higher levels. The index is moving in a Higher Top and Higher Bottom formation on the daily chart indicating a short term up trend. The chart pattern suggests that if Banknifty crosses and sustains above 34000 level it would witness buying which would lead the index towards 34300-34600 levels. However if index breaks below 33600 level it would witness selling which would take the index towards 33500-33000. Banknifty is trading above 20 day SMA's indicating positive bias in the short to medium term. Banknifty continues to remain in a downtrend in the medium term, so selling on rallies continues to be our preferred strategy. The daily strength indicator RSI is moving upwards and is above its reference line indicating positive bias. The trend deciding level for the day is 33980. If BANK NIFTY trades above this level then we may witness a further rally up to 34200-34580-34805 levels. However, if BANK NIFTY trades below 33980 levels then we may see some profit booking initiating in the market, which may correct up to 33595-33375-32990 levels.
To Read Complete Report & Disclaimer Click Here
For More Axis Securities Disclaimer https://simplehai.axisdirect.in/disclaimer-home
SEBI Registration number is INZ000161633
Views express by all participants are for information & academic purpose only. Kindly read disclaimer before referring below views. Click Here For Disclaimer