Global Prime Residential Index witnesses an annual increase of 4.6%: Knight Frank Prime Global Cities Index Q1 2021
Follow us Now on Telegram ! Get daily 10 - 12 important updates on Business, Finance and Investment. Join our Telegram Channel
https://t.me/InvestmentGuruIndiacom
Download Telegram App before Joining the Channel
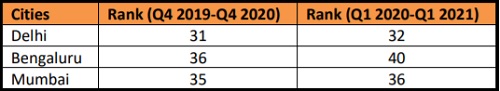
* New Delhi ranks 32nd and Mumbai 36th outperforms Bengaluru (40th)
* New York was the weakest-performing global city during the period, with luxury home prices falling by 5.8%
MUMBAI, 6 th May 2021: Knight Frank, a leading international property consultancy, in its ‘Prime Global Cities Index Q1 2021’ report cited that Bengaluru moves down four spots in the latest index at 40th rank in the first quarter of 2021. Against 36th rank in Q4 2020, Bengaluru saw a decline of 2.7% year-on-year (YoY) in prime residential prices, leading to the drop in global position. The premium micro-markets of the city recorded a fall of 0.6% in annual capital value change in Q1 2021 to an average price of Rs 19,200 per sq. ft.
New Delhi and Mumbai also move one spot down to 32nd and 36th rank, respectively, in Q1 2021 compared to 31st and 35th rank in Q4 2020. New Delhi on the global index remained unchanged in terms of annual capital value change in the prime residential market to an average price of Rs 33,572 per sq. ft. in Q1 2021. Whereas Mumbai's prime residential market registered a decline of 0.1% with an average price of Rs 63,758 per sq. ft.
Prime residential property is defined as the most desirable and most expensive property in a given location, generally defined as the top 5% of each market by value. The Prime Global Cities Index is a valuation-based index tracking the movement in prime residential prices in local currency across 45+ cities worldwide using Knight Frank’s global research network.
According to Knight Frank’s research analysis, 26 cities witnessed a rise in prime residential prices in Q1 2021. Eleven cities registered double-digit priced growth up from just one a year ago. The Prime Global Cities Index, an unweighted price index of prime residential prices across 45+ cities, increased by 4.6% compared to 1.9% in Q4 2020. According to the report, 67% of the global cities registered flat or positive yearly price growth; while Shenzhen recorded the strongest performing world region in the year to Q1 2021 with 18.9%, New York was the weakest performing market -5.8%.
Some of the world's top metropolises, New York (-6.8%), Dubai (-4%), London (-4%), Paris (-4%) and Hong Kong (-3%), is seeing prices soften. Due to higher tax rates, policy constraints, etc.
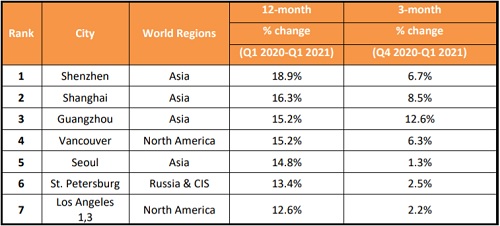
THE KNIGHT FRANK PRIME GLOBAL CITIES INDEX Q1 2020 (RANKED BY ANNUAL % CHANGE)

While Bengaluru moved down by four places in Q1 2021; Delhi and Mumbai dipped one places each in the same period.
Shishir Baijal, Chairman and Managing Director at Knight Frank India said, “The decline in prices of prime residential properties in India during the first quarter of 2021 can be attributed to multiple factors such as uncertainty around the second wave of the pandemic, high liquidity in capital markets, as well as the backlog of supply. Regardless, there is a propensity for consumption of prime residential properties in India as the country continues to inoculate its workforce to distance itself from the precariousness of future waves of the virus.”
Key Highlights:
* Mumbai and Delhi’s prime residential market performed better than Bengaluru.
* Bengaluru ranked 40th with a -2.7% annual price change for Q1 2020 – Q1 2021. The city registered a marginal decline of 0.6% in Q1 2021.
* Delhi ranked 32nd with a -0.2% annual price change for the period Q1 2020 – Q1 2021. The city saw a flat 0.00% price change in Q1 2020 compared to the previous quarter.
* Mumbai ranked 36th with a -1.5% annual change for the period Q1 2020 – Q1 2021. The city registered a price decline of -0.1 % in Q1 2021 compared to the previous quarter
* Shenzhen ranked 1 st with 18.9% annual change for the period Q1 2020 – Q1 2021. The city registered an increase of 6.7% price in Q1 2021 compared to the previous quarter.
* New York ranked 46th with a -5.8% annual change for the period Q1 2020 – Q1 2021. The city registered a price decline of 1.6% in Q1 2020 compared to the previous quarter.
To Read Complete Report & Disclaimer Click Here
Above views are of the author and not of the website kindly read disclaimer