Weekly Commodity Outlook Of 09-05-2021 By Swastika Investmart
FUNDAMENTALS OF COMMODITY:
* Copper futures climbed above the $4.7 per pound mark for the first time, as inventories stand at levels not seen in fifteen years, while speedy vaccination rollouts and trillions in dollars of economic stimulus boosted demand. Recent economic readings from the United States and China reinforced this view, while President Biden’s multitrillion-dollar infrastructure plan lent further optimism to the copper bulls. Also, given how crucial copper is in the transition to a carbon-free world, demand is due to outstrip supply due to lack of investment by large miners.
* Gold has climbed above the $1,840 level for the first time since February in reaction to a disappointing payroll report which also spooked investors away from the dollar and pushed Treasury yields sharply lower. The US economy added 266K jobs in April of 2021, following a downwardly revised 770K rise in March and well below market expectations of 978K. Aside from the economic headlines, the precious metal benefited from safehaven demand stemming from the ongoing coronavirus crises as infection rates continue to accelerate in India and Japan.
* WTI crude futures traded around $64.7 a barrel on Friday, on course for the weekly gain buoyed by upbeat economic data from the US and China, a much sharper than expected drop in US crude inventories and an improved demand outlook in advanced economies such as the US and the EU. Elsewhere, Tehran might see sanctions lifted if negotiations to revive the 2015 nuclear deal between Iran and the US are successful.
Technical indicators (Daily):
* RSI- 60.9341
* MACD- 351.5999
* MOVING AVERAGES (20,50,100)- (47259/45905/47334)
MCX GOLD CHART
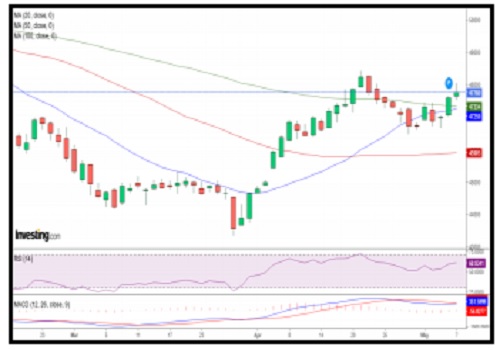
Technical indicators (Daily):
* RSI- 56.0886
* MACD- 73.8452
* MOVING AVERAGES (20,50,100)- (4713/4604/4266)
MCX CRUDE OIL CHART
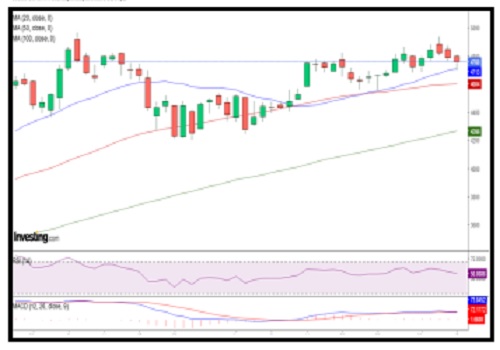
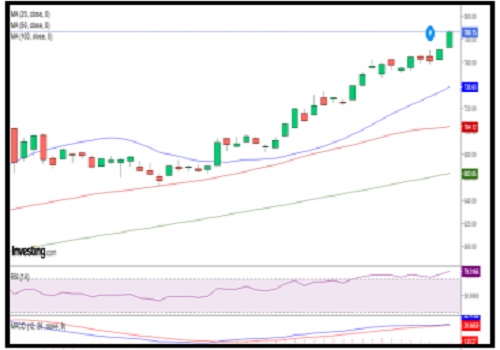
Technical indicators (Daily):
* RSI- 79.3166
* MACD- 22.4786
* MOVING AVERAGES (20,50,100) - (738.68/704.12/663.65)
MCX COPPER CHART
To Read Complete Report & Disclaimer Click Here
Please refer disclaimer at https://www.swastika.co.in/disclaimer
Views express by all participants are for information & academic purpose only. Kindly read disclaimer before referring below views. Click Here For Disclaimer