Weekly Nifty and Bank Nifty outlook by Deepesh Sarawagi, Technical Analyst, Choice Broking

NIFTY WEEKLY OUTLOOK 24-07-2026
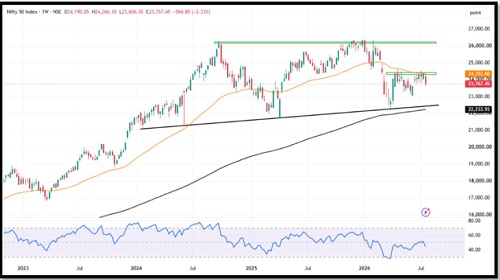
The Nifty 50 witnessed a weak and volatile week as sustained selling pressure dragged the index sharply lower. The index opened the week at 24,190.05, touched a high of 24,266.10, slipped to a low of 23,606.30, and finally settled at 23,767.45, ending the week with a loss of 566.85 points (-2.33%). During the initial trading sessions, Nifty traded in a narrow consolidation range of 24,150–24,250, indicating indecisiveness among market participants. However, the index later witnessed a decisive breakdown on the hourly chart, which triggered aggressive selling during the middle of the week. In the Friday trading session, buying interest emerged near the crucial 23,600 support zone, resulting in short covering and a sharp intraday recovery. The rebound also helped the index fill the downside gap created on 15th June, while the recovery pattern closely resembled the buying seen during the previous week's final trading session.
The weekly price action reflects a cautious undertone, with the broader trend remaining under pressure despite the late recovery. Although buyers defended the 23,600 region, the index continues to trade below its recent consolidation zone, suggesting that bulls are yet to regain complete control. The hourly breakdown followed by short covering highlights that market participants are becoming active near lower levels; however, sustained buying above key resistance levels will be required to confirm any meaningful trend reversal.
From a technical perspective, Nifty continues to trade below its short-term moving average (20-week EMA) and is still struggling to reclaim the 100-week EMA, indicating weak medium-term momentum. At the same time, the index remains comfortably above the 200-week EMA, suggesting that the long-term trend continues to remain positive despite the ongoing correction. The weekly RSI stands at 44.61, remaining below the neutral 50 mark, reflecting weakening momentum but also hinting at improving buying interest after the recent recovery from support.
For the coming week, 23,500–23,400 will act as the immediate support zone, while 24,000–24,100 remains the key resistance area. The index is likely to remain range-bound unless a decisive move occurs beyond these levels. As long as Nifty holds above the support zone, further recovery attempts cannot be ruled out; however, failure to sustain could invite renewed selling pressure. Traders are advised to remain stock-specific and follow disciplined risk management while keeping a close watch on these important technical levels.
Support Levels: - 23,500 – 23,400
Resistance Levels: - 24,000 – 24,100
Overall Bias: - Sideways
BANKNIFTY WEEKLY OUTLOOK 24-07-2026
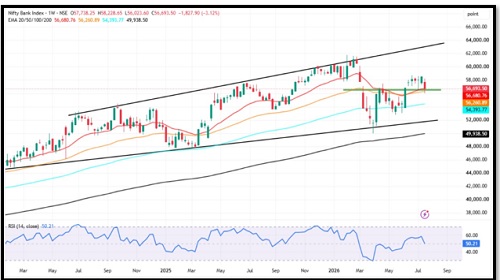
Bank Nifty witnessed a volatile and corrective week as profit booking intensified after failing to sustain at higher levels. The index opened the week at 57,738.25, touched a high of 58,228.65, slipped sharply to a low of 56,023.60, and finally settled at 56,693.00, registering a weekly loss of 1,827.90 points (-3.12%). During Tuesday's session, the index formed a Gravestone Doji on the daily chart after testing the weekly high near 58,228, indicating rejection from higher levels and exhaustion in buying momentum. Following this bearish signal, Bank Nifty witnessed aggressive selling throughout the remainder of the week, breaking below the important 56,500 support level. However, buying interest emerged near the 56,000 zone, where the index found support around the 20-week and 50-week EMAs, resulting in a recovery from the week's low.
The weekly price action reflects a cautious undertone despite the late recovery from support. The sharp rejection from higher levels followed by the breakdown below the previous support suggests that sellers currently have the upper hand in the short term. At the same time, the strong rebound from the 56,000 support zone indicates that buyers continue to defend lower levels, making this an important demand area for the coming week. Sustaining above this zone will be crucial for any meaningful recovery in the index.
From a technical perspective, the broader trend continues to remain constructive as Bank Nifty is trading comfortably above its short-term, medium-term and long-term weekly exponential moving averages, reflecting that the long-term structure remains intact despite the recent correction. The successful defence of the 20-week and 50-week EMAs further strengthens the significance of the current support zone. The Weekly RSI stands at 50.21, remaining just above the neutral 50 mark, indicating balanced momentum with neither bulls nor bears having a decisive advantage. A sustained move above the immediate resistance zone could revive buying momentum, while failure to hold support may lead to further consolidation.
For the coming week, 56,000–56,100 will act as the immediate support zone, while 57,300–57,400 remains the key resistance area. The index is expected to trade within a 56,000–57,400 range, and a decisive breakout on either side is likely to determine the next directional move. Until then, traders are advised to remain stock-specific, maintain disciplined risk management, and closely monitor price action around these important technical levels.
Support: 56,000–56,100
Resistance: 57,300–57,400
Overall Bias: Sideways
For Detailed Report With Disclaimer Visit. https://choicebroking.in/disclaimer
SEBI Registration no.: INZ 000160131