Utilities Sector Update : Power demand witnessed a strong growth in Aug`23 By JM Financial Services
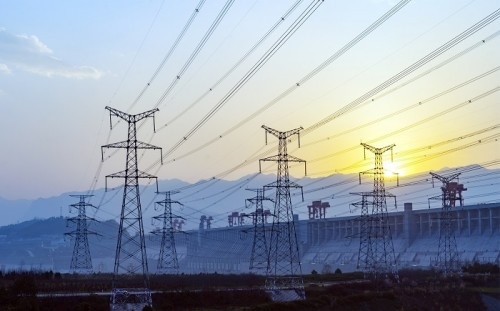
Power demand witnessed a strong growth in Aug’23. With the energy demand in the range of 4,500-5,130MU, the peak demand averaged 221GW vs. 199GW in Jul’23. Polysilicon and module prices after a long downward trajectory showing signs of consolidation whereas the tariffs for RE projects are increasing which bodes well for solar capacity additions. International coal prices continue to moderate although the pace of decline has slowed down. A total of 54/9/16GW of Solar, Wind and SW Hybrid; and 8/19/27GW of Nuclear/Hydro/Thermal projects are under construction. Overall project execution particularly in RE and hydro is expected to pick up pace. Here, we present a collection of 45 charts/exhibits representing important data points that help us track energy transition in India.
* Power demand: The power demand remained robust in Aug’23. Monthly peak demand recorded 21% YoY growth whereas the energy demand grew by 15% YoY in Aug’23. All-India peak demand reached 239.98GW on 1 st Sep’23; it breached the previous high of 237GW and 223GW in Aug’23 and Jun’23 resp. Daily energy demand too breached 5BU, first time ever in India. The shortage in power supply rose by 65% YoY to 766MU in Aug'23 against 465MU in Aug'22. This was the highest deficit recorded since Jun'22.
* Power generation: Total power generation improved by 14% YoY to 160BU during Aug’23 as compared to 140BU in Aug’22. The share of RE in total generation continues to grow, stood at 13.9% in Aug’23.
* Renewables: With a lot of policy actions, declining input costs and the upswing in tariffs (INR 2.71/kWh in CY23 from INR 2.40/kWh in CY21), the pace of solar project execution is expected to further pick up in ensuing months. Wind capacity installations in India rose 144% YOY to 1,307MW during the YTDFY24. We expect this momentum to sustain going forward.
* Tariff: Average tariff in the day-ahead spot power market increased sharply to INR 6.9/kWh in Aug’23 (INR 4.5/kWh in Jul’23) primarily higher peak demand deficit. The prices on the exchange touched INR 10/kWh multiple times during the month.
* PLF: With rising demand, utilisation (PLF) of coal-fired power plants continues to improve; it stood at 68.1% in Aug’23 against 58.1% in Aug’22.
* Generation capacity: During Apr-Jul’23, 4,365MW of Solar, 1,307MW of Wind, 874MW of thermal and 700MW of nuclear capacities have been added. With this, the installed capacity (as of Jul’23) in the country stands at 423GW with non-fossil /RE contributing 185/131GW to the total base (71GW – solar; 44GW – Wind). A total of 54/9/16GW of Solar, Wind and SW Hybrid; and 8/18.8/26.7GW of Nuclear/Hydro/Thermal projects are under construction. A total of 24GW of coal-fired projects are under stress. Of the 27GW thermal plants under construction, 9.6GW capacity is expected to commission in FY24.
* Coal: Production of coal continues to rise, registering 11.4% YoY growth to 361MT in YTDFY24. Coal India (CIL) surpassed its target of 700MT in FY23 and is now targeting to produce 780MT in FY24. Indonesian coal prices (5,900kcal/kg) moderated from peak levels of Mar’22 (USD 218/tn) to USD 88/tn in Aug’23. However, the South African coal and Australian coal prices have on an average, increased by 8-12% MoM in Aug’23 on the back of increased thermal demand.
* Solar input material cost: The prices of solar components, viz., polysilicon, wafers and, cells have declined upto Jun’23 from their highs due to global capacity expansions and systemic oversupply. Polysilicon prices, declined from USD 38.8/kg in Aug’22 to USD 7.8/kg in Jun’23 but have started gradually inching up to USD 9.9/kg in Sep’23. Solar cell prices declined from USD 0.17/piece in Aug’22 to USD 0.10/piece in Aug’23
Please refer disclaimer at https://www.jmfl.com/disclaimer
SEBI Registration Number is INM000010361


