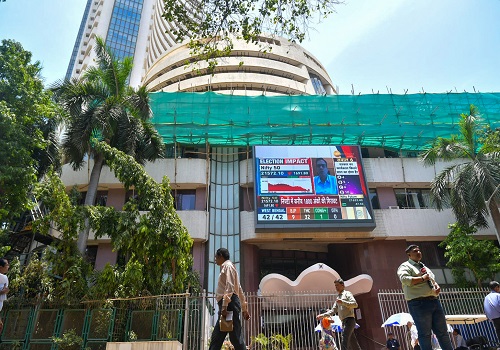
Turmeric trading range for the day is 13832-15064 - Kedia Advisory

Gold
Gold prices declined by 0.86% to settle at Rs.97,036, pressured by stronger-than-expected U.S. labor market data and easing trade tensions. The U.S. economy added 139,000 jobs in May, surpassing expectations of 130,000, while wage growth reached 3.9%, beating the projected 3.7%. The unemployment rate held steady at 4.2%, indicating underlying strength in the labor market. These positive figures dampened safe-haven demand and reduced the urgency for gold investment in the short term. Additionally, investor sentiment improved after President Donald Trump and Chinese President Xi Jinping agreed to resume trade negotiations, reducing geopolitical uncertainties. Despite the pullback, gold remains up about 1.50% for the week, supported earlier by safe-haven buying triggered by the U.S. decision to impose 50% tariffs on steel and aluminium imports. However, domestic demand in India weakened as prices hovered near record highs, prompting dealers to offer the deepest discounts in over a month—up to $56 an ounce below official rates. In contrast, Chinese dealers maintained premiums of $10–$14, signaling relatively stronger demand. Other Asian markets such as Hong Kong, Singapore, and Japan saw mixed activity, with premiums remaining modest. Global gold demand rose by 1% year-on-year in Q1 2025 to 1,206 metric tons, driven by a 170% surge in investment demand, according to the World Gold Council. Technically, the market is under long liquidation, with open interest falling 10.41% to 13,646. Gold now finds support at Rs.96,405, and a break below could test Rs.95,770. Resistance is seen at Rs.98,125, above which prices could rise toward Rs.99,210.
Trading Ideas:
* Gold trading range for the day is 95770-99210.
* Gold prices eased following a stronger-than-expected U.S. jobs report.
* Pressure also seen after a phone call between Trump and Xi, agreeing to resume stalled trade negotiations.
* The U.S. economy added 139,000 jobs in May, beating expectations of 130,000.
Silver
Silver prices climbed by 0.97% to settle at Rs.105,459, driven by strong industrial demand and persistent supply deficits. This rally is further supported by a narrowing gold-silver ratio, which now stands around 94, down sharply from April’s peak of 105—its highest since May 2020. The sustained bullish tone in silver is rooted in ongoing structural market deficits, marking the fifth consecutive year of supply shortfall. Although the deficit is forecasted to narrow by 21% in 2025 to 117.6 million troy ounces, the market remains fundamentally tight due to resilient demand. Key drivers include robust industrial demand, especially from green economy applications. Industrial fabrication is expected to grow by 3% in 2025, surpassing 700 million ounces for the first time. Despite a projected 6% drop in jewelry demand—largely attributed to high domestic prices in India—total global silver demand is anticipated to remain broadly stable at 1.20 billion ounces. On the investment side, silver bars and coins are forecast to rise 7% this year after last year's 22% plunge, signaling improving sentiment in Western markets, particularly in Europe and North America. Macro indicators also lend support, with weaker U.S. economic data—rising jobless claims, slowing private employment, and declining services activity—fueling expectations of a Fed rate cut in September. Technically, silver is under fresh buying pressure, with open interest rising 3.19% to 21,238. Immediate support is seen at Rs.104,870, with a break below targeting Rs.104,290. Resistance is expected at Rs.106,085, and a move above could push prices toward Rs.106,720.
Trading Ideas:
* Silver trading range for the day is 104290-106720.
* Silver prices surged, driven by strong industrial demand and ongoing global supply deficits.
* The gold-silver ratio dropped to ~94, down from April’s peak of 105, signaling silver’s relative outperformance.
* Silver is facing its fifth consecutive year of a structural market deficit.
Crude oil
Crude oil prices surged by 1.69% to settle at Rs.5,534, supported by a stronger-than-expected U.S. jobs report that helped ease recession fears and boosted the demand outlook. The labor market data, showing 139,000 jobs added in May, reaffirmed economic resilience and investor confidence. Geopolitical sentiment also turned more constructive, as tensions between President Trump and Elon Musk appeared to ease, and anticipation grew for a U.S.–China trade meeting expected within a week, raising hopes for improved bilateral relations and trade flows. Supply-side dynamics also played a key role. Wildfires in Canada temporarily slashed about 7% of the nation's oil output, although rain later helped contain the situation. Meanwhile, Saudi Arabia is reportedly advocating for a substantial OPEC+ production increase of at least 411,000 barrels per day in August and possibly September, aimed at addressing elevated summer fuel demand. U.S. crude inventories fell by 4.304 million barrels in the week ending May 30, the largest draw since November 2024, far exceeding expectations of a 0.9 million barrel decrease. On the global front, the International Energy Agency (IEA) trimmed its oil demand growth outlook for the rest of 2025 to 650,000 barrels per day due to economic headwinds and growing electric vehicle adoption. Technically, crude oil is experiencing fresh buying, as evidenced by a 31.12% rise in open interest to 8,865. Immediate support lies at Rs.5,430, with further downside potential to Rs.5,326. On the upside, resistance is seen at Rs.5,600, and a break above could propel prices toward Rs.5,666.
Trading Ideas:
* Crudeoil trading range for the day is 5326-5666.
* Crude oil rises as strong US jobs data eases economic worries, boosts demand view.
* US–China trade talks are expected within a week, lifting market sentiment.
* Canadian wildfires disrupted about 7% of oil output, though rainfall has recently helped contain the situation.
Natural gas
Natural gas prices surged by 1.88% to settle at Rs.325.7, driven by a combination of lower output and stronger-than-expected demand forecasts for the upcoming two weeks. Despite robust injection trends, with U.S. utilities adding 122 billion cubic feet (bcf) to storage in the week ending May 30—well above the market estimate of 111 bcf—bullish sentiment prevailed. This marked the seventh consecutive week of triple-digit additions, a feat last matched in June 2014. However, even with the high pace of injections, current storage levels remain 10% below last year’s levels, though still 4.7% above the five-year average. On the production front, average output in the Lower 48 U.S. states has dipped to 104.8 bcfd so far in June, down from 105.2 bcfd in May and below the March peak of 106.3 bcfd. The decline in output, coupled with warmer-than-average weather forecasts through June 21, has lifted demand projections—especially from the power sector, where natural gas is heavily used for air conditioning. Looking ahead, the U.S. Energy Information Administration (EIA) projects record-setting trends for both production and consumption. Dry gas production is expected to reach 104.9 bcfd in 2025 and 106.4 bcfd in 2026, while domestic consumption is forecast to rise to 91.3 bcfd in 2025. Technically, the market is showing signs of fresh buying, evidenced by a sharp 36.2% jump in open interest to 19,042. Immediate support lies at Rs.317.6, with further downside potential to Rs.309.5. On the upside, resistance is seen at Rs.330.5, and a breakout could push prices toward Rs.335.3.
Trading Ideas:
* Naturalgas trading range for the day is 309.5-335.3.
* Natural gas prices fell due to rising daily output and reduced LNG export flows
* Fast-growing amounts of gas in storage also kept pressure on prices.
* U.S. gas storage levels are now 5% above seasonal norms, pressuring prices further.
Copper
Copper prices fell by 0.5% to settle at Rs.875.8, primarily due to profit booking after copper inventories on the Shanghai Futures Exchange (SHFE) rose 1.5% from the previous week. Despite the pullback, the downside remained limited amid ongoing concerns over global supply disruptions and hopes for easing U.S.-China trade tensions. Notably, production delays at Teck Resources' operations in Chile and issues at the Kamoa-Kakula mine in the Democratic Republic of Congo continue to tighten the global copper supply chain. Adding to the supportive tone, London Metal Exchange (LME) copper stocks have declined significantly, dropping to 138,000 tons—the lowest in nearly a year and down almost 50% since the start of 2025. This trend indicates robust demand from manufacturing sectors. However, investor uncertainty increased after President Trump signed an executive order doubling tariffs on steel and aluminum, fueling fears that copper may soon face similar restrictions. Fundamentally, the global refined copper market showed a surplus of 17,000 metric tons in March, sharply narrowing from 180,000 tons in February, according to the International Copper Study Group (ICSG). Copper imports into China remained flat year-on-year in April at 438,000 tons, though total imports for the first four months of 2025 fell by 3.9%. Technically, the market witnessed long liquidation as open interest dropped 2.26% to 6,995 contracts. Immediate support is placed at Rs.872.3, with further downside possible to Rs.868.8. On the upside, resistance is seen at Rs.881.5, and a move above this could push prices toward Rs.887.2.
Trading Ideas:
* Copper trading range for the day is 868.8-887.2.
* Copper falls on profit booking as SHFE inventories rose by 1.5%.
* Downside was limited by hopes of easing US-China trade tensions and ongoing supply disruptions.
* LME copper inventories fell to 138,000 tons, the lowest in nearly a year, down nearly 50% year-to-date.
Zinc
Zinc prices fell by 0.76% to close at Rs.253.4, as traders engaged in profit booking amid ongoing uncertainty in global trade dynamics. Market sentiment remained fragile due to lingering tariff concerns and the lack of concrete progress in U.S.-China trade negotiations. Broader weakness across the global metals complex added to the cautious tone. The demand outlook continues to be pressured by slowing industrial activity, particularly in China, where the manufacturing PMI remained in contraction territory for the second consecutive month. This has raised expectations of fresh economic stimulus from Beijing aimed at reviving factory output and, consequently, zinc consumption. On the supply side, the global zinc market surplus narrowed to 23,700 metric tons in March from 75,900 tons in February, according to the International Lead and Zinc Study Group (ILZSG). For the first quarter of 2025, the cumulative surplus stood at 143,000 tons, slightly lower than the 148,000-ton surplus recorded in the same period last year, indicating marginal tightening in supply-demand dynamics. In China, refined zinc production in May dropped 1% month-on-month but rose about 2% year-on-year. However, the January-May cumulative output growth of just over 0.5% YoY fell short of expectations. Technically, the zinc market is undergoing long liquidation, evidenced by a 2.93% decline in open interest to 2,852. Key support lies at Rs.252.1, with further downside likely towards Rs.250.8. Resistance is seen at Rs.255.3, and a breakout above this level could push prices toward Rs.257.2.
Trading Ideas:
* Zinc trading range for the day is 250.8-257.2.
* Zinc prices dropped on profit booking amid ongoing uncertainty around trade negotiations and tariffs
* Coupled with the expected significant increase in zinc ingot production in June, supply pressures persist.
* China’s manufacturing PMI continued to contract for the second consecutive month.
Aluminium
Aluminium prices declined by 1.04% to settle at Rs.237.8, weighed down by renewed concerns over China's economic health. A private survey indicated that China's composite PMI fell to a two-and-a-half-year low, largely due to weakness in the manufacturing sector, despite continued strength in services. This development has sparked fears of slowing demand from the world's largest aluminium consumer, putting downward pressure on prices. Despite the bearish macroeconomic signals, the physical market remains tight. Aluminium premiums in the United States surged to a record $1,323 per metric ton (or 60 cents/lb), following the Trump administration’s imposition of higher tariffs on aluminium imports. In response to market developments, Goldman Sachs revised its aluminium price forecast upward by $140 to $2,280 per ton for the second half of 2025, although the bank projects a decline to $2,100 per ton by early 2026 due to anticipated easing in the supply-demand imbalance. On the production front, China’s aluminium output rose 4.2% year-on-year in April to 3.75 million metric tons. Meanwhile, aluminium exports also surged, with China shipping nearly 5.5 million tons of unwrought aluminium and related products in the first ten months of the year, marking a 17% rise compared to the same period last year. Technically, the market is undergoing long liquidation, evidenced by a 0.89% drop in open interest to 4,227. Support lies at Rs.236.1, with further downside potential towards Rs.234.4. On the upside, resistance is seen at Rs.240.2, and a move beyond this could lead prices toward Rs.242.6.
Trading Ideas:
* Aluminium trading range for the day is 234.4-242.6.
* Aluminium prices declined amid renewed concerns over China’s economy.
* China’s aluminium production in May 2025 increased by 2.7% YoY and 3.4% MoM.
* Goldman Sachs raised its aluminium price forecast for H2 2025 by $140/ton to $2,280.
Cottoncandy
Cottoncandy futures fell by 0.56% to close at Rs.53,300 amid long liquidation pressure, as open interest declined by 2.7% to 72 lots. The price drop reflects bearish sentiment triggered by a marginal upward revision in India's cotton production estimates for the 2024–25 season. The Cotton Association of India (CAI) raised the output forecast to 291.35 lakh bales from 291.30 lakh bales, mainly due to improved yields in Odisha. Despite the production uptick, overall market fundamentals remain sluggish. CAI cut its domestic consumption forecast by 8 lakh bales to 307 lakh bales, suggesting weaker demand from the textile sector. Furthermore, cotton exports were lowered to 15 lakh bales, significantly down from last season’s 28.36 lakh bales, signaling waning overseas demand. On the import front, figures remain elevated at 33 lakh bales, with 27.5 lakh already imported by April — more than double last year’s volume. Consequently, ending stocks are projected to rise to 32.54 lakh bales by September 30, 2025, compared to 30.19 lakh bales last year, reflecting a more relaxed supply situation. Globally, the U.S. cotton balance sheet showed minor adjustments: exports reduced by 100,000 bales to 10.9 million, while ending stocks were increased to 5 million bales. The world cotton outlook also saw a drop in mill use, production, and trade, while ending stocks were revised higher. Technically, Cottoncandy finds support at Rs.52,870, and a break below could drag prices to Rs.52,450. Resistance is expected at Rs.53,850, with potential to test Rs.54,410 if momentum reverses.
Trading Ideas:
* Cottoncandy trading range for the day is 52450-54410.
* Cotton dropped amid slight upward revision in India’s output estimate.
* CAI cut consumption forecast by 8 lakh bales to 307 lakh for the 2024–25 season.
* Cotton exports expected to fall to 15 lakh bales, down 13.36 lakh from last year.
* In Rajkot, a major spot market, the price ended at 25838.2 Rupees dropped by -0.28 percent.
Turmeric
Turmeric futures rose by 1.55% to settle at Rs.14,580, supported by persistent concerns over low arrivals and reduced production estimates. The market witnessed short covering, evident from a sharp 15.71% decline in open interest to 10,170, even as prices gained Rs.222. In the Nizamabad spot market, turmeric prices also strengthened, closing at Rs.14,563.95 with a 0.67% increase. Despite the rise, gains were capped by a surge in daily arrivals to 57,500 quintals, nearly doubling from the previous session’s 29,860 quintals. Additionally, weak export inquiries limited the upside. While the area under turmeric cultivation increased to 3.30 lakh hectares — up 10% from the previous season — productivity is expected to fall due to untimely rains and issues like small rhizomes and crop rot, especially in the Nanded region. Last season’s production stood at 10.75 lakh tonnes, but this year’s yields are projected to be 10–15% lower. At the Duggirala market, new arrivals are drawing robust buyer interest, with higher prices being offered for fresh crops due to superior quality. Nearly 50–55% of the new crop has already been traded, and strong market activity is expected to continue through June. On the export front, turmeric shipments from April 2024 to March 2025 rose 8.83% to 1.76 lakh tonnes. However, March 2025 exports were down 13.41% YoY but up 20.39% MoM. Technically, turmeric finds support at Rs.14,206, and a break below could test ?13,832. Resistance is seen at Rs.14,822, with a possible move toward Rs.15,064 if bullish momentum continues.
Trading Ideas:
* Turmeric trading range for the day is 13832-15064.
* Turmeric gains amid persistent concerns about low arrivals and lower production estimates.
* However upside seen limited owing to weak export enquiries.
* Turmeric exports during Apr - Mar 2025, jump by 8.83 percent at 176325.34 tonnes compared to Apr - Mar 2024.
* In Nizamabad, a major spot market, the price ended at 14563.95 Rupees gained by 0.67 percent.
Jeera
Jeera settled higher by 0.43% at Rs.19,840, supported by lower-level buying from domestic participants despite subdued export demand. The price rise came amid continued inactivity from foreign buyers and pressure from comfortable supplies. Total arrivals in key mandis increased to 32,900 bags from 28,000 in the previous session, adding supply-side pressure to the market. The start of the new cumin crop in major producing states like Gujarat and Rajasthan has been delayed by about a month due to unfavorable weather conditions, which may limit fresh arrivals in the near term. Despite low demand, current export business is being fulfilled from existing stocks. Farmers still hold around 20 lakh bags, with only 3-4 lakh bags expected to be traded by the season's end, leaving a large carry-forward stock of approximately 16 lakh bags. Jeera exports during April 2024 to March 2025 rose significantly by 39.63% to 212,502 tonnes compared to the previous year. March exports showed a strong monthly increase of 33.40% over February 2025, despite being down 46.03% compared to March 2024. Imports during the same period fell drastically by 93.20%, with only 1,194 tonnes imported. March 2025 imports saw a modest rise compared to the previous month and a notable increase versus March 2024. Technically, the market is witnessing short covering, with open interest declining by 10.92% to 4,113. Jeera finds support at Rs.19,730, with a possible test of Rs.19,620 if prices dip further. On the upside, resistance lies at Rs.20,000, and a sustained move above this level could see prices challenging Rs.20,160.
Trading Ideas:
* Jeera trading range for the day is 19620-20160.
* Jeera gains due to lower level buying from domestic buyers despite subdued export demand.
* The current season is expected to have similar production levels as last year due to better crop conditions.
* Jeera exports during Apr - Mar 2025, rose by 39.63 percent at 212502.49 tonnes compared Apr - Mar 2024.
* In Unjha, a major spot market, the price ended at 20419.95 Rupees dropped by -0.28 percent.
Views express by all participants are for information & academic purpose only. Kindly read disclaimer before referring below views

