The Nifty opened the trading session on positive note and continued the bullish momentum in the first half - ICICI Direct

Nifty :23668
Technical Outlook
Day that was… Indian equity benchmarks witnessed a volatile session where it settled Tuesday’s trading session on a flat note at 23,668, up by 10 points. The Nifty Midcap and Small cap indices underperformed the benchmark move with losses of 1.06% and 1.56%, respectively. Sectorally, IT and Financial Services outperformed while Consumer durables, PSU Bank and Metal index were laggard.
Technical Outlook
• The Nifty opened the trading session on positive note and continued the bullish momentum in the first half. However, profit booking at higher levels resulted in Nifty to give up on its intraday gains and close on a flat note. The price action resulted in a small bear candle with long upper wick, indicating slowdown in upward momentum.
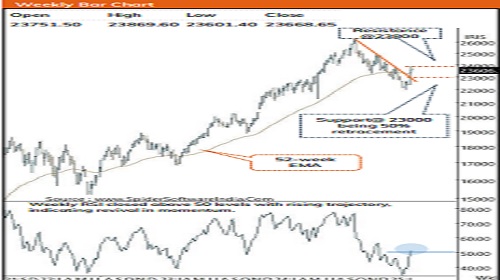
• Key point to highlight is that, the Nifty faced resistance around previous swing high of 23800, coinciding with 61.8% retracement of previous fall (24858- 21964). The sharp ~1,500-point rally in Nifty (over past seven sessions), resulted the daily stochastic oscillator entering into overbought territory; hence chances of pullback cannot be ruled out. Going ahead, a decisive close below the previous day swing low would indicate pause in upward momentum and would result into healthy retracement, which will eventually pave way for further upside towards 24200. The previous five-month “sell-on-rally” approach has now shifted to a “buy-on-dips” strategy as sentiment has improved. As long as 23,000 remains intact, the focus should be on accumulating quality stocks with a medium-term perspective.
• Structurally, the Nifty witnessed a faster pace of up-move where it regained previous 19 days of fall in just 14 trading session, indicating structural turnaround backed by improvement in breadth as well as sentiment indicator. Any pullback from here should be capitalized as buying opportunity, wherein volatility will prevail, amid upcoming result season and tariff related clarity from Trump. Given this historical precedent, we believe the index is approaching price-wise maturity with limited downside and is poised for the next leg of the uptrend. Our constructive bias is validated by following observations:
• a. The ratio chart of Nifty/Dow Jones has recorded a breakout from a six-month falling channel, indicating the domestic market could relatively outperform US equities going forward.
• b. The cool off in US 10-year Yields, Dollar Index and Brent crude augurs well for emerging markets by easing inflation and boosting sentiment.
• On the broader market front, the Midcap and Small cap indices closed above their 100-week EMA, breaking out from a three-month falling trendline, an encouraging sign of inherent strength. Both the indices have seen a rebound after approaching maturity of price and time wise correction. Moving ahead stock specific action can be witnessed amid upcoming result season. Hence, the focus should be on accumulating quality stocks (backed by strong earnings) in a staggered manner.
• The critical support for the Nifty stands at 23,000, which represents a 50% retracement of the current upmove (21,965–23,869). This level is expected to act as a strong cushion, ensuring that dips remain buying opportunities rather than trend reversals
Nifty Bank : 51608
Technical Outlook
Day that was :
The Bank Nifty settled the Tuesday’s volatile session on a marginally negative note at 51608 , down by 97 points . Meanwhile, both the Nifty PSU Bank index underperformed the benchmark where it closed at 6219 , down by 1 .73 % .
Technical Outlook :
• The Bank Nifty witnessed a gap -up opening and continued the bullish momentum from previous session . However, profit booking from higher level resulted in a small bear candle with long upper wick, indicating slowdown in upward momentum .
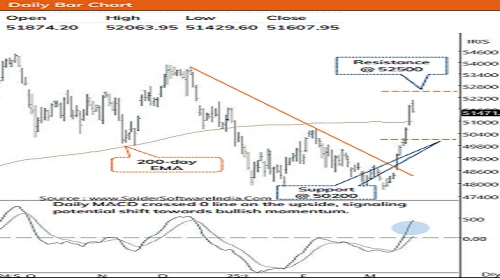
• Key point to highlight is that, the index encountered resistance around previous swing high as well as the psychological mark of 52000 and gave up its intraday gains . Given the sharp ~4250 - point rally in Bank Nifty (over past nine sessions), the daily stochastic oscillator has entered in overbought zone, indicating possibility of temporary breather in coming sessions . The faster pace of retracement observed from the multi -support zone of 47800 assisted the index to regain its past five weeks decline in just a single week, indicating structural turn around . Moving ahead, a decisive close below the previous day swing low would indicate pause in upward momentum and would result into healthy retracement, which will eventually pave way for further upside towards 52500 being 80 % retracement mark of the previous fall (53888 -47703 ) . ) . Meanwhile, any pullback should be viewed as a buying opportunity rather than a negative reversal . On the other hand, the near -term support is placed at 50200 which is 38 . 2 % Fibonacci retracement mark of the recent up - move (47703 -51801 ) .
• Structurally, the Bank Nifty bounced from the vicinity of 100 -week EMA after forming a triple bottom pattern . Additionally, the faster pace of retracement resulted in the momentum indicators to rebound from bearish extremes . The weekly stochastic oscillator has observed a bullish crossover suggesting structural strength .
• Mirroring the benchmark index, the Nifty PVT Bank index witnessed a breather after facing resistance at previous swing high as well as the psychological mark of 26000 . After ~2200 points of sharp up -move, the daily stochastic oscillator has entered into overbought zone, suggesting possibility of breather in coming sessions . However, any pullback for hereon should be capitalized as buying opportunity for the upside towards 26500 being 80 % retracement of previous fall (27280 -23508 ) .
Please refer disclaimer at https://secure.icicidirect.com/Content/StaticData/Disclaimer.html
SEBI Registration number INZ000183631