

The index started the week on a positive note and settled a volatile session at 24,722, up 0.64% - ICICI Direct

Nifty : 24722
Technical Outlook
Day that was…
* The index started the week on a positive note and settled a volatile session at 24,722, up 0.64%. Market breadth favoured the advances with an A/D ratio of 1.5:1. Sectorally, Nifty Financial Services and FMCG extended their losses, while Metals, Auto, IT, and other sectors outperformed the benchmark. Meanwhile, the Nifty Midcap and Smallcap indices also outperformed, gaining in the range of 1.20% to 1.40%..
Technical Outlook:
* The daily price action formed an inside bar as supportive efforts emerged near the 100-day EMA which has held firm over the past six sessions, indicating prolonged consolidation.
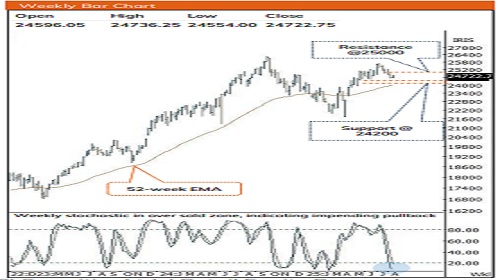
* Nifty is likely to witness subdued opening tracking overnight comment on Indian tariff. However, its is important to watch out for how index react to this news as holding key support of 24500 despite such news would signify strength and open the door for gradual recovery towards 25000 in the coming weeks. Any further development related to tariff negotiation’s outcome would dictate the further course of action. Traders should note that, since Covid lows, the index has not closed on a negative note for more than 5 consecutive weeks and subsequently witnessed a technical pullback. In the current scenario, the past five weeks' corrective move (-4%) has hauled weekly stochastic oscillators in oversold conditions (placed at 11), indicating impending pullback. Hence, traders should refrain from creating aggressive short positions at the current juncture. However, to pause the downward momentum, a decisive close above the previous session is a prerequisite.
* On the broader market front, the midcap index is currently trading below its two months low, indicating pause in upward momentum. Hence, it’s important to keep stock centric approach while focusing on stocks backed by strong earnings
* On the structural front, we are in a secular bull market, wherein intermediate corrections due to Global as well as domestic uncertainties have offered incremental buying opportunities from a medium term perspective. Hence, we advise investors not to panic in current tariff led volatility, instead capitalize current corrective phase to build quality portfolio backed by strong earnings in a staggered manner
* Key monitorable to watch out for in current volatile scenario:
* 1.Development of Bilateral trade deal negotiations.
* 2.RBI Policy.
* 3.U.S. Dollar index has pulled back and likely to retest past 2 years breakdown area of 100.50. Failure to sustain above it would result in resumption of the down trend.
* 4.India VIX: after 11 weeks India VIX is likely to close above previous week high. Further, bounce back from the cyclical low of 10 suggests a rise in volatility going ahead
Nifty Bank : 55619
Technical Outlook
Day that was...
* The index began the week on a flat to positive note, navigating intraday volatility to close marginally higher at 55,637, up 0.02%. Meanwhile, the Nifty Private Bank index slightly outperformed the benchmark, ending on a firm note at 26,960, up 0.15%
Technical Outlook:
* The daily price action formed a small bullish candle with equal wicks on both ends, lacking strong follow-through in either direction, signalling as a sign of short-term consolidation.
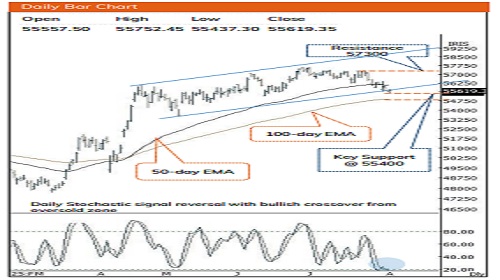
* Key point to highlight is that Bank Nifty has shown resilience near the lower boundary of its ascending channel, successfully holding support at 55,400, which also aligns with its 100-day EMA since late April 2025, sustaining a higher-high, higher-low structure despite intermittent geopolitical headwinds. This week markets will closely monitor the RBI’s upcoming interest rate policy announcement, along with developments in the ongoing India-US trade tariff negotiations. Going ahead we believe as long as the index holds above 55,400, a pullback toward 56,800-57,300 cannot be ruled out. A decisive breakout above this level, would open the next leg of up move. Additionally, the daily stochastic oscillator has slipped below 10, entering oversold territory and hinting at a potential reversal.
* Since April, intermediate corrections have remained shallow while the index has consistently held above its 100-day EMA. Moreover, over the past eleven weeks, the index has retraced 50% of the preceding 8.50% up move seen in the prior five weeks. The slower pace of retracement highlights a robust price structure, which augurs well for the next leg of the uptrend. However, any extended correction from current levels could find immediate support near the 54750 zone which is 50% retracement level of its preceding rally and confluence with 100-day EMA base support.
* The PSU Bank Index outperformed the benchmark, forming a bullish candle and closed above the previous session high. Index reclaimed its closing above 100-day EMA after today’s up move, wherein it also continues to trade above the 200-day EMA along with 50% retracement of the preceding rally (from 6065 to 7305), both placed near 6685 offering a meaningful downside cushion, a key support that had held since May. While the Bank Nifty consolidates within 3.5% of its all-time high, PSU Banks continue to lag, trading 16% below their peak, thereby presenting a possible catch-up opportunity. Despite the ongoing weakness, the index maintains a higher-high, higher-low structure as per Dow Theory since its breakout on May 19, with immediate support seen around 6,700, which aligns with the 20- Source: Bloomberg, Spider, ICICI Direct Research
Please refer disclaimer at https://secure.icicidirect.com/Content/StaticData/Disclaimer.html
SEBI Registration number INZ000183631


More News

Quote on Market 14th October 2025 by Vinod Nair, Head of Research, Geojit Investments Limited

