The index started the session on a negative note and witnessed selling pressure near the previous session`s high - ICICI Direct

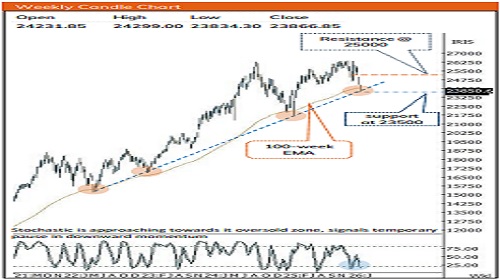
Nifty :23867
Technical Outlook
Day that was.. The Indian equity benchmark witnessed a significant hit, erasing recent gain as significant geopolitical tensions and oil supply fear weighed heavily on investor sentiment. The Nifty settled at 23,918, down 1.60%. Market breadth remained neutral, wherein Smallcap relatively outperformed the benchmark, declining 0.50. Sectorally, barring Pharma, all major sectoral indices closed in the red, with Auto, BFSI were the top loser
Technical Outlook:
* The index started the session on a negative note and witnessed selling pressure near the previous session’s high. As a result, the daily price action formed a bearish candle with a lower high–lower low intraday structure, indicating that intraday recovery attempts remained shortlived.
* Index is likely to open with a gap-down amid ongoing geopolitical tension that has led to sharp surge in Brent crude prices. A key point to note is that the index failed to witness follow-through strength after the past two sessions of recovery and slipped below the previous session’s low, indicating a resumption of the corrective phase. Going ahead, the formation of lower high-low clearly signifies corrective bias leading to extended correction wherein strong support is placed at 23500-23200 zone. Meanwhile, to pause the ongoing corrective move, a decisive close above the bearish gap aera of 24300-24,400 would be a pre-requisite. The key support of 23,200-23,500 zone based on following observations:
* A) 61.8% retracement of April25-Jan26 upmove(21743-26373)
* B) 52 weeks EMA has the utmost importance from long term perspective in technical analysis. Past three decades data shows that, in a secular bull market secondary correction tend to find its feet 6-7% below its 52 weeks EMA. In current scenario such correction would mature around 23500
* C) Positive Gap aera seen during mid-April 2025 (22924-23207)
* Over the past four decades, the market has witnessed six major geopolitical escalations, during which the index corrected by ~11% over a median four-week period. In the current scenario, the index has already corrected ~8% over the past week and is now trading in the vicinity of the lower band of the rising channel in place since June 2022, which coincides with the 100-week EMA, thereby highlighting a strong structural support zone
* Market Breadth: With current decline, the % of stocks above 50- and 200-days SMA have once again pulled down to 25% levels. Historically, such contractions in breadth have preceded durable market bottoms, with extreme bearish readings in the range 15-20%
Key Monitorable:
* Brent Crude Oil: Crude oil continues to cool-off post its recent spike in prices amid geopolitical tension in Middle East. Further cool-off in crude oil price will boost the sentiment for Indian equities.
* US & India Inflation print. Intraday Rational:
* Trend- Lower high-low formation after two sessions up move, indicate corrective bias
* Levels- Sell around 50% retracement of previous session range (24,375-23,912
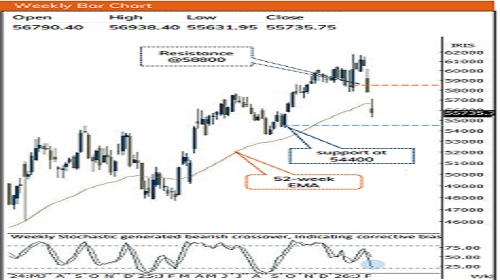
Nifty Bank :55736
Technical Outlook
Day that was:
The market concluded the session on a negative note, with the Bank Nifty settling at 55736, down 2%, while the Nifty PSU Bank Index mirrored the benchmark, declining 1.8%.
Technical Outlook:
* The index opened on a negative note and extended its decline throughout the session. As a result, the daily price action formed a long bearish candle with a lower high-low intraday structure, signalling sustained selling pressure and lack of intraday recovery.
* The index failed to witness follow-through buying after the prior two sessions of recovery and breached the previous session’s low, indicating resumption of the short-term corrective phase. However, over the past eleven sessions the index has corrected nearly 10%, pushing the stochastic oscillator towards the oversold territory in both the daily and weekly timeframes, currently placed near 22 and 26, indicating the possibility of a technical pullback from lower levels can not be ruled out.
* However, to pause the ongoing decline, index need to decisively close above the bearish gap (57696-57100). A decisive move above this zone could trigger a next leg of up move
* On the downside, the 54,200 zone remains a crucial support being a swing low recorded on 29th September 2025.
* Structurally, since April 2025 the index has consistently held above its 52-week EMA. In the current setup, it has once again approached this long-term moving average, currently placed near 56,600. Historically, during a secular bull market, secondary corrections tend to extend up to ~3% below the 52-week EMA. Applying the same framework, the current corrective phase could potentially mature near the 54,900 region.
* The PSU Bank Index formed a bearish candle with a lower high-low structure near the falling trendline resistance, indicating continued supply at higher levels. However, bouts of volatility cannot be ruled out as strong support is placed at 8,600, coinciding with the 100-day EMA and the recent panic low
Please refer disclaimer at https://secure.icicidirect.com/Content/StaticData/Disclaimer.html
SEBI Registration number INZ000183631