

The index opened the week on a subdued note, facing resistance at 20-day EMA on three occasions - ICICI Direct

Nifty :24968
Technical Outlook
Week that was…
* Equity benchmarks extended losses over third consecutive week in the absence of clarity on India - US bilateral trade deal. Nifty lost 0.72% to settle the week at 24968. However, broader showed resilience, outperforming by gaining 1% during the week. Sectorally, Realty, PSU Bank, Auto remained at forefront while Defence, IT extended losses.
Technical Outlook:
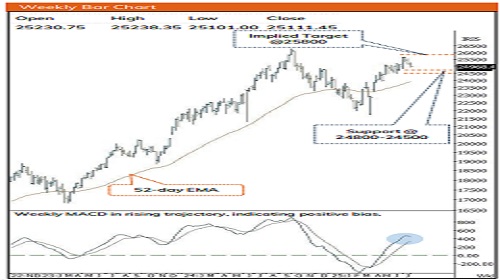
* The index opened the week on a subdued note, facing resistance at 20-day EMA on three occasions. It subsequently retested the 50-day EMA on Friday, culminating in the formation of a small bearish candle, signaling an extended pause in the recent momentum.
* In the upcoming week, volatility to remain elevated as one third of Nifty weightage has came over the weekend with steady Q1 earnings post market hours, we believe going forward focus should be on the US bilateral trade agreement and Q1 earning that would trigger momentum in the market. With current 2.9% correction, Nifty has approached lower band of rising channel. We expect index to find supportive efforts in the vicinity of 24800-24500 zone and gradually stage a rebound wherein 25800 would continue to act as resistance.
* Structurally, since April intermediate corrections have been limited to 3% while sustaining above its 50 days EMA. In addition to that, over past 14-days index has retraced 61.80% of preceding 11-days 5% up move. Slower pace of retracement indicating robust price structure that bodes well for next leg of up move. Hence, focus should be on accumulating quality stocks on dip backed by strong earnings.
Key Monitorable which will dictate the further course of action:
a) Earnings update from index heavy weights would be important to watch out for.
b) All eyes will be on outcome of US-India bilateral trade deal.
c) Falling US Dollar index would result into FII's inflow.
d) India VIX has extended losses and sustaining below one year low of 12, indicating participants anxiety at lowest level.
* Structurally, the formation of higher peak and trough while absorbing host of negative news around geo-political issues coupled with absence of US – India trade tariff decision. Further, strong market breadth depict strength as currently 65% stocks of Nifty 500 universe are trading above 200-days SMA compared to last weeks reading of 60% while last month reading was 52%. This signals that the market is building strength for the next leg higher..
* We revise our support base at 24800-24500 zone for the Nifty which is based on 50% retracement of recent rally (23936-25669) and 20-
Nifty Bank : 56283
Technical Outlook
Week that was
* The Bank Nifty extended its losing streak for the third consecutive week amid a lack of clarity surrounding the India -US bilateral trade deal . The index declined by 0 .83 % , settling the week at 56 ,283.. The Nifty Pvt Bank index under performed the benchmark closed on a negative note, and ended at 27 ,534 .50 , down 1 .93 % .
Technical Outlook
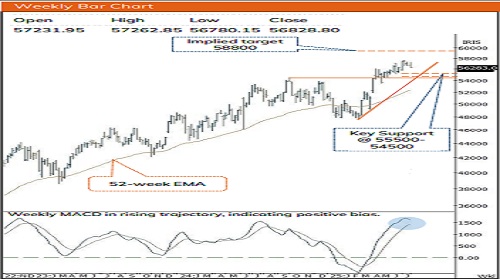
* The Bank Nifty opened the week on a flat note and managed to sustain above the 20 -day EMA for four sessions . However, extended profit booking on Friday led the index to close below the 20 -day EMA and retested three -month horizontal trendline . This resulted in the formation of a small bear candle indicating a potential breather in the ongoing trend .
* Key point to highlight is that Index since April, intermediate corrections have remained shallow limited to just 3 % , while the index has consistently held above its 50 -day EMA . Moreover, over the past three weeks, the index has retraced 50 % of the preceding 4 .50 % up move seen in the prior three weeks . The slower pace of retracement highlights a robust price structure, which augurs well for the next leg of the uptrend . We expect index to find supportive efforts in the vicinity of 55500 -54500 zone and gradually stage a rebound wherein 57500 would act as resistance once closed above it that will open the gates towards 58800 levels in coming quarter which is the implied target of the consolidation from (56098 -53483 ) . Consequently, any dip from current levels could offer fresh buying opportunities .
* Outperforming the benchmark, PSU bank closed on a positive note, indicating inherent strength . After breaking out from an eleven -month falling trendline on 19th May, the index has maintained a higher -high - low structure on the weekly chart, signaling an intact uptrend . While Bank Nifty trades below ~ 2 . 5 % from its all -time highs, the PSU Bank index remains about ~12 % below its all -time high, presenting a compelling case for a catch -up move . Immediate support on the downside is placed at 6 ,700 , which is the recent swing low and coincides with the 20 -week EMA .
* Structurally, Bank Nifty is undergoing phase -wise expansion, with each rally establishing new price zones of acceptance . Instead of sharp directional moves, the index is progressing through brief consolidations that serve as launchpads for subsequent advances . This transition from volatility -driven swings to range -bound bases suggests increasing market maturity, with demand emerging at higher levels . The narrowing amplitude of corrections indicates that stronger hands are absorbing supply, maintaining trend continuity .
Please refer disclaimer at https://secure.icicidirect.com/Content/StaticData/Disclaimer.html
SEBI Registration number INZ000183631


More News

Daily Technical Report 10th June 2026 by Axis Securities Ltd


