The index displayed signs of further weakness after closing below its 50 DEMA support level of 25,054 - Tradebulls Securities Pvt Ltd

Follow us Now on Telegram ! Get daily 10 - 12 important updates on Business, Finance and Investment. Join our Telegram Channel
Nifty
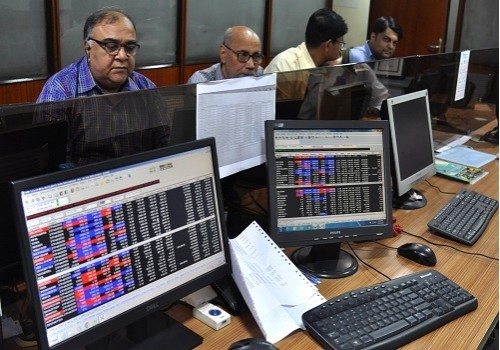
The index displayed signs of further weakness after closing below its 50 DEMA support level of 25,054, extending its five-session selloff. The index is now approaching its critical trend support zone placed near its 5-month EMA of 24,760, with the daily RSI approaching the oversold level, and the ADX turning neutral at 38. On the 60-minute chart, a Price-RSI divergence suggests that a short-term bottom could be forming soon. Options data further supports this view, highlighting the 25,000-24,500 range as key zone for establishing declining wave to terminate, with potential area for a final decline towards 24,500, aligning with the 20 WEMA support. Early signals of a potential reversal price pattern suggest the short-term downtrend could be in its final phase. However, confirmation from additional data is crucial to assess the strength of any rebound. Momentum traders may look to adopt a mixed approach with both long and short positions while the index remains under 25,080. For investors, the current demand zone between 24,760-24,500 could offer an opportunity to accumulate long positions in a staggered manner

Please refer disclaimer at https://www.hdfcsec.com/article/disclaimer-1795
SEBI Registration number is INZ000171337


Tag News

Bears colour stock market red ahead of Christmas, time for balanced investment strategy


More News

Pre-Market Comment by Hardik Matalia , Research Analyst, Choice Broking


 320-x-100_uti_gold.jpg" alt="Advertisement">


