The Bank Nifty witnessed selling pressure in first half of the trading session - ICICI Direct

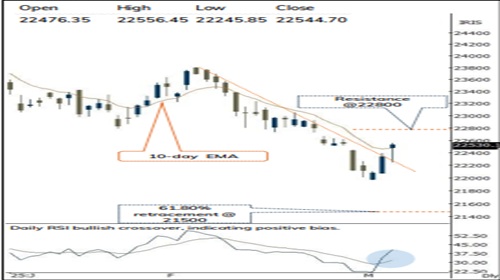
Nifty :22545
Technical Outlook
Day that was
Indian equity benchmarks closed positive on today’s weekly expiry tracking positive global cues. The Nifty closed at 22,545, up by ~1%. The market breadth was strong in favor of advances, with an A/D ratio of 3:1, as the broader market outperformed, driven by small-cap, which gained ~1.3%. Sector-wise, barring Realty, all sectors closed in the green, with Oil & Gas, Metal and Pharma outperformed.
Technical Outlook:
* The Nifty opened gap-up (22337-22476) and initially declined, filling the closing gap. However, it later formed a higher high-low structure, as intraday declines were bought into, pushing the index to close near the day’s high. As a result, the daily price action formed a small bull candle with a lower wick, indicating buying interest at lower levels.
* A key point to highlight is that, for the first time in 20 sessions, the Nifty gave a follow-through buying and closed above previous sessions high, leading to the breakout of a four-week falling trendline, indicating renewed momentum. As a result, index filled the negative gap seen during 28th February, this improvement makes us believe that the index is poised for an upward move towards the 22800 level. Meanwhile, 21800 -21500 would continue to act as key support. Our view of a technical pullback is backed by the following observations:
* a The US Dollar Index breached its 2025 lows and is now sustaining well below the 105 mark. A declining US Dollar Index bodes well for a pullback in emerging markets.
* b. Brent crude oil has breached its October low on an intraday basis and is now sustaining below the $70 mark, which augurs well for the Indian economy and equity markets.
* c. The monthly stochastic oscillator is in the extreme oversold territory at 13 (lowest since 2002), indicating an impending pullback.
* d. Market breadth recently hit a bearish extreme, as the % of stocks (within Nifty 500 universe) above their 50 and 200 days SMA dropping to 8 and 10 , respectively, during the corrective phase. However, it has now rebounded to 17 and 13, indicating early signs of recovery. Historically, such bearish readings have paved the way for a durable bottom in the subsequent weeks.
* e. The US 10-year bond yields has corrected ~70 bps January high and has formed a bearish evening star candlestick pattern on the monthly chart, reinforcing the corrective bias.
* On the broader market front, the Midcap and Small cap indices, witnessed supportive efforts from the decade-long trendline (Adj Jan 08 high and Oct 21 high) coupled with a positive divergence of the RSI, suggesting that the midcap index could witness extended pullback toward 51500, while the small-cap index may reach 16000 levels. Hence, the focus should be on accumulating quality stocks (backed by strong earnings) in a staggered manner.
* Structurally, after five-months 16% decline, index has now approached the longterm rising trendline (Adj Jun22 low and Mar23 low) amid oversold conditions. The formation of a lower high-low signifies corrective bias, wherein strong support is placed around the 21800-21500 zone due to the confluence of:
* a) 61.80% retracement in the vicinity of 21500 from the rally (16828-26227)
* b) A rising trendline drawn adjoining subsequent major lows off Jun-22 (15183) is placed at 22000.
* c) The 24-month EMA support is placed in the vicinity of 22000.
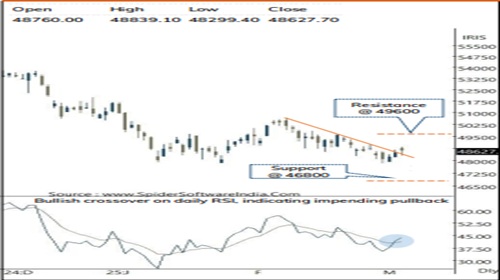
Nifty Bank : 48628
Technical Outlook
Day that was
The Bank Nifty experienced a volatile session, amid benchmark’s weekly expiry where it settled the day on a positive note at 48628 , up by 138 points . The PSU Banking index outperformed the benchmark move and closed at 5929 , up by 0 .66 % .
Technical Outlook:
* The Bank Nifty witnessed selling pressure in first half of the trading session . However, supportive efforts near previous days low assisted the index in recovering most of the intraday decline, resulting in a small bearish candle with long lower shadow .
* Key point to highlight is that, the Bank Nifty witnessed a falling trendline breakout (drawn adjoining the highs of 17th Feb & 19th Feb), indicating structural improvement . Additionally, the index is trading in a higher high low pattern after defending the lower end of the broader consolidation range of 49600 -48700 , for the third time in past two months, signifying supportive effort at lower level . Going ahead, a follow through buying above previous weeks high (48972 ) would be the initial sign of revival in upward momentum towards the upper end of the consolidation range (49600), coinciding with 52 -week EMA . On the downside, near -term support is placed at 46800 which is 61 . 8 % retracement of Oct -23 to Sept -24 rally (42105 -54467 ) .
* Structurally, with 12 % correction already in place the index has approached and is now consolidating near the lower band of 2 years rising channel, which is also in the vicinity of 100 -week EMA . Holding the lows and forming a base at this juncture would keep the pullback option open .
* In tandem with the benchmark index, the Nifty PSU Bank index witnessed a follow through buying for the third consecutive session where it closed on a positive note . Additionally, the daily RSI observed a trendline breakout, indicating acceleration to the ongoing pullback . Going ahead, the key monitorable will be whether the index manages to close above the previous weeks high, which has been missing since last 12 weeks . However, a close above the previous week high will fuel the upwards momentum in coming weeks .
Please refer disclaimer at https://secure.icicidirect.com/Content/StaticData/Disclaimer.html
SEBI Registration number INZ000183631


More News

Quote on the impact of the tensions in middle-east on Indian equities from Dr. V K Vijayakum...