The Bank Nifty index is likely to face significant resistance in the 57,000–57,500 range - Choice Broking Ltd

Nifty

Benchmark indices extended their losing streak for the third straight session on July 11, dragged by weakness in IT stocks post-TCS earnings and concerns over potential global trade disruptions following former US President Trump’s tariff remarks. The Nifty 50 closed the week at 25,149.85, down 205 points or 0.81%, breaching the crucial support zone near 25,330.
Technically, Nifty has broken below its previous swing low on the daily chart, indicating that the index is undergoing a short-term corrective phase from higher levels. The price is now approaching the key Fibonacci support zone near 25,000, where a reversal signal may emerge, given that the broader trend remains bullish.
Momentum indicators show weakening sentiment. The RSI is at 48.75 and trending downward, while the MACD has given a negative crossover, both suggesting caution. A close above 25,330 could reignite bullish momentum, potentially targeting 25,670–26,000. On the downside, if 25,000 breaks decisively, the next support lies at 24,750.
Support Levels: 25100-25000
Resistance Levels: 25300-25600
Overall Bias: Sideways
Bank Nifty
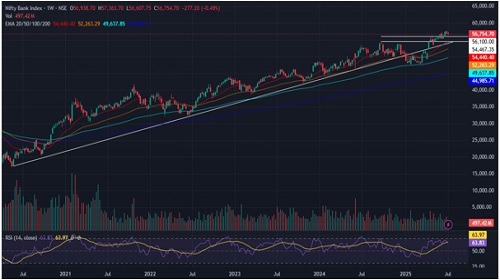
The Bank Nifty index closed at 56,754.70, registering a 0.49% decline from the previous week's close. The weekly chart indicates rejection at higher levels, as the index failed to sustain above the crucial 57,000 mark. This selling pressure suggests a potential pause in the ongoing uptrend, pointing towards a likely sideways to bearish or consolidation phase in the near term.
This week, the Bank Nifty index formed a bearish-bodied candle with a long upper wick and a slight lower wick, supported by consistent trading volumes. This reflects sustained selling pressure and limited buying interest at higher levels, indicating the potential for consolidation or a mild corrective phase in the near term. As long as the index holds below the 57,500 mark, a "sell on rise" strategy is advisable, with downside targets placed at 56,500 and 56,000.
On the weekly timeframe, Bank Nifty is trading above all its key moving averages, including the short-term 20-day, medium-term 50-day, and long-term 200-day Exponential Moving Averages (EMA), indicating an overall uptrend. However, the selling pressure at higher levels and the inability to sustain above the crucial 57,000 mark suggest that the index is entering a consolidation phase. Key downside support is placed in the 56,500–56,000 range. The Relative Strength Index (RSI) stands at 63.83, indicating a sideways momentum. This consolidation phase could lead to either a time-wise or price-wise correction as the index awaits fresh triggers for its next directional move.
The Bank Nifty index is likely to face significant resistance in the 57,000–57,500 range. If the index continues to move higher, Kotak Bank from the private banking sector is expected to support the uptrend. Similarly, in the public sector banking space, SBIN is anticipated to show strength and contribute to any potential upside.
For the ongoing expiry, put options show the highest concentration near the 56,500 and 56,000 strikes, marking these as key support levels. Conversely, significant open interest in call options at 57,000 and 57,500 indicates potential resistance, suggesting a likely trading range of 56,000–57,500 in the upcoming sessions. Traders are advised to remain cautious, consider a sell on rise approach, and maintain strict stop-loss levels to manage risks effectively amid ongoing market volatility and potential price fluctuations.
Support: 56500-56000
Resistance: 57000-57500
Bias- Sideways
For Detailed Report With Disclaimer Visit. https://choicebroking.in/disclaimer
SEBI Registration no.: INZ 000160131


More News

Nifty Extends Winning Streak, Closes Near 24,000 Mark - HDFC Securities Ltd