Strategy: 2QFY26 Nifty-500 Index review: Commodity-led growth by Sanjeev Prasad, MD & Co-Head, Kotak Institutional Equities

2QFY26 Nifty-500 Index review: Commodity-led growth
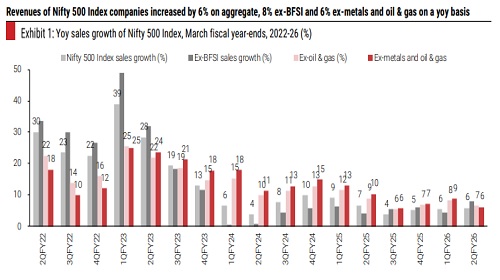
Nifty 500 Index companies reported strong earnings growth (+15% yoy) in 2QFY26, led by strong earnings growth of metals and oil, gas & consumable fuels; excluding them, yoy earnings growth was 8%. Nonetheless, smaller sectors reported an improvement in sales growth, with 17/30 sectors reporting double-digit growth, even as aggregate sales growth was at 6% yoy.
Nifty 500 companies saw 6% sales growth, 17% EBITDA growth, 15% PAT growth
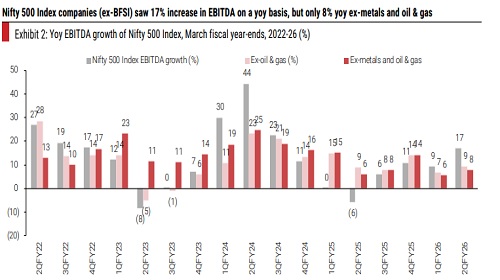
2QFY26 results of the Nifty 500 companies show that the broader universe continues to struggle with modest revenue growth (+6% yoy); see Exhibit 1. However, EBITDA grew 17% yoy, while PAT grew 15% yoy (see Exhibits 2-3). Metals and oil, gas & consumable fuels drove the strong yoy growth in EBITDA and PAT in aggregate; EBITDA and PAT growth was around 8% yoy, excluding them. Interestingly, quarterly PAT levels have been stagnant around Rs3.6 tn for six quarters (see Exhibit 4). Nonetheless, there were signs of improvement with 17/30 sectors reporting double-digit sales growth. Exhibits 5-7 show sector-wise growth in key financials over 2QFY22-2QFY26.
Weak sales growth across market caps; weak base aided profit growth
The contribution of the top-100 companies to revenues of the Nifty 500 Index universe has remained stable at around 70%, while the contribution to PAT has moderated to 73% (see Exhibit 8). Sales growth remains weak across market caps, even as mid- and small-caps delivered strong EBITDA and PAT growth. We note that a weak base aided strong PAT growth for 10/19 mid-cap. sectors and 7/14 small-cap. sectors. Exhibits 9-11 show the sectoral earnings growth in the Nifty 500 Index universe by market cap.
Margins declined 40 bps yoy and 70 bps qoq (ex-BFSI, metals and oil & gas)
Nifty 500 Index companies reported a 130 bps yoy increase but 17 bps decline qoq in margins in 2QFY26 (see Exhibit 12). However, profitability was down 40 bps yoy and 70 bps qoq, ex-BFSI, metals and oil, gas & consumable fuels (see Exhibit 13). Lower raw material cost-to-sales appears to be the key driver for the improvement in aggregate margins, while employee cost-to-sales has seen a steady increase in recent quarters (see Exhibits 14-15).
Large-caps and mid-caps witnessed stabilizing earnings outlook
The earnings outlook seems to have become better on aggregate over the past two months, especially for large- and mid-cap. stocks (see Exhibit 16), with earnings being broadly stable. However, the sectoral analysis of change in consensus earnings estimates suggests that the earnings stabilization is led by modest upgrades in some of the larger sectors such as oil, gas & consumable fuels, banks, metals & mining and IT services (see Exhibit 17). Exhibit 18 gives a sense of the breadth of earnings downgrades/upgrades by market cap. Nonetheless, we note that the Street is expecting strong earnings growth in a large number of sectors in 2HFY26 (see Exhibit 19).
Above views are of the author and not of the website kindly read disclaimer


More News

Daily Derivatives Report 30th July 2025 by Axis Securities Ltd