Sluggish Credit Growth and Repricing Weigh on Bank Margins in Q1FY26 by CareEdge Ratings
Synopsis
* Scheduled Commercial Banks (SCBs) reported a rise of 8.9% y-o-y in net advances for Q1FY26. PVBs advances increased by 8.1% y-o-y, while PSBs grew comparatively higher at 11.0% y-o-y, mainly attributed to the higher growth share of priority sector lending (PSL). Meanwhile, deposits grew by 11.0% y-o-y in Q1FY26. CASA ratio declined by 120 bps y-o-y and stood at 37.3% in Q1FY26 as compared to 38.5% in Q1FY25.
* The Credit-Deposit (CD) ratio witnessed a decline and was below the 80% mark. As of Q1FY26, the CD ratio stood at 78.9%, down by 40 bps over a year ago.
* Net Interest Income (NII) of select SCBs grew at a slower pace of 4.1% in Q1FY26, reaching Rs 3.96 lakh crore, compared to Rs 3.81 lakh crore in Q1FY25, while the Net Interest Margin (NIM) for SCBs in Q1FY26 reduced by 18 basis points (bps) to 3.24% on a y-o-y basis. This can be attributed to the faster transmission of lending rate cuts, vis-à-vis a lag in deposit repricing, as well as reduced offtake from higher-yielding segments, such as NBFCs, unsecured personal loans, and microfinance loans.
Movement of Net Interest Margin and Net Interest Income
Figure 1: Net Advances Growth: PSBs Outpace PVBs in y-o-y but lag sequentially
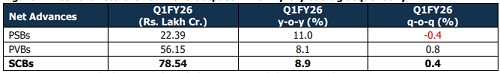
* SCBs reported a moderate increase of 8.9% y-o-y in net advances for Q1FY26, attributed to weak industrial credit demand and slower retail movement. PVBs' advances increased by 8.1% y-o-y, while PSBs grew faster at 11.0% y-o-y. Sequentially, out of seven PSBs, three reported a moderate increase in net advances, led by retail, agriculture, and MSME segments. At the same time, the remaining four saw a decline, driven by a strategic decision (highlighted in the management commentary) to moderate credit growth and prioritise profitability over expansion.
Figure 2: NII Growth: Slower Expansion Across SCBs
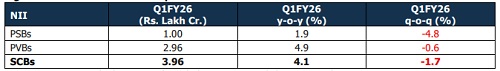
* SCBs NII slowed by 4.1% in Q1FY26 as compared to 12.7% in Q1FY25. Meanwhile, PVBs grew by 4.9% yo-y, however, PSBs increased marginally by 1.9% in Q1FY26. This moderate growth was driven by a shift in loan mix towards lower yield segments and an increased cost of funds with declining CASA share.
* Interest income of SCBs rose by 6.0% y-o-y in Q1FY26, PVBs rose by 5.7%, while PSBs grew at 6.8%.
* Meanwhile, interest expenses of SCBs rose by 7.4% y-o-y in Q1FY26. PVBs grew by 6.4% y-o-y and PSBs by 10.0% on the back of slightly higher term deposit growth across SCBs. Ongoing repricing of deposits is expected to support banks.
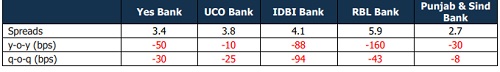
* Sequentially in Q1FY26, NII for SCBs saw a marginal decline of 1.7%. Among SCBs, PVBs reported a relatively smaller dip of 0.6%, while PSBs registered a contraction of 4.8%. Several PSBs recorded a sequential decline in NII due to a fall in yield on advances and sticky cost of deposits, leading to narrowing spreads.
Figure 3: NIM Trend (%): SCBs on a declining trend
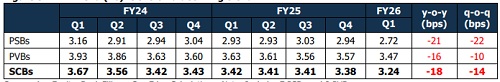
* NIM declined by 18 bps y-o-y in Q1FY26. PVBs and PSBs declined by 16 bps and 21 bps y-o-y, respectively, due to subdued credit growth particularly in the corporate and unsecured segment. PVBs are focussed on managing their elevated CD ratio. At the same time, intensifying competition in the home loan market driven by PSBs offering lower interest rates due to faster transmission of EBLR-linked loans compared to PVBs has further pressured lending margins, contributing to overall margin compression. Additionally, a quicker reduction in lending rates compared to deposit rates has weighed on banks NIMs.
* Sequentially, SCBs dropped by 14 bps, wherein PVBs decreased by 10 bps, and PSBs declined by 22 bps primarily due to increased exposure to low-yield segments such as housing loans and repricing of loans for prime clients. Additionally, a 90 bps fall in CASA ratio, sticky term deposit rates amidst a 13% growth in term deposits, and a decline in yield on advances collectively exerted sustained pressure on margins and reduced pricing flexibility, further dragging NIMs.
Figure 4: Movement in CASA Ratio
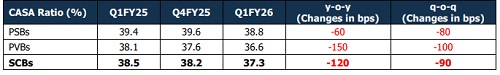
Despite a moderate rise in net advances and deposits, the CASA ratio declined to 37.3% in Q1FY26, down from 38.5% in Q1FY25. This decline was primarily driven by a shift toward higher-yielding term deposits, along with increased deployment of funds into alternative instruments, fuelled by deposit repricing and strong inflows into term deposits, while retail CASA inflows remained tepid. As a result, banks access to low-cost funding weakened. Despite ample liquidity in the system, raising CASA deposits continued to be challenging. Consequently, CASA deposits contracted by 3.0% year-on-year, adversely affecting the overall funding mix.
Figure 5: Yield on Advances (%)
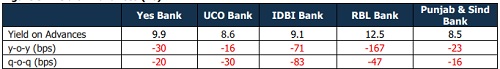
Figure 6: Cost of Funds (%)
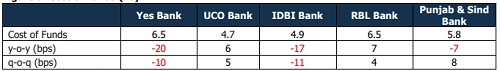
Figure 7: Spreads (%)
Conclusion
In Q1FY26, banks continued to face pressure on NIMs amid subdued business growth. Faster transmission of lending rate cuts, along with a lag in deposit repricing and reduced offtake from high-yield segments like NBFCs, and unsecured personal loans, weighed on margins. By the end of May 2025, SCBs' Weighted Average Outstanding Lending Rate (WALR) stood at 9.67%, while the average yield on advances stood marginally lower at 9.40% in Q1FY26, attributed to rising NPAs, faster repricing of loans after the repo rate cut, and differences between contractual interest and realised income. NIMs are likely to remain subdued until the share of higher-yielding loans increases, or deposit costs are adjusted downward later in the year.
In Q2FY26, growth is expected across rural markets, the agri sector, and select MSME segments, despite pricing pressure. Urban retail demand is expected to grow with the onset of the festive season in Q2 and Q3 of FY26. The full impact of the June 2025 repo rate cut of 50 bps is anticipated to flow through in Q2FY26, along with ongoing deposit repricing. Meanwhile, banks are focused on increasing their CASA share over the medium term through diversification of their product mix. In the second half of FY26, improved liquidity conditions are expected to boost lending activity. However, due to the cumulative impact of rate cuts, banks' NIMs are expected to contract by 20– 25 bps over FY26. Unless there’s a policy change, any benefit from a CRR cut is likely to occur from Q3FY26.
Above views are of the author and not of the website kindly read disclaimer