Silver Report 05th Feb 2025 by Amit Gupta, Kedia Advisory
Silver’s 2026 Crash Echoes 1980 and 2011—but With a Modern Twist
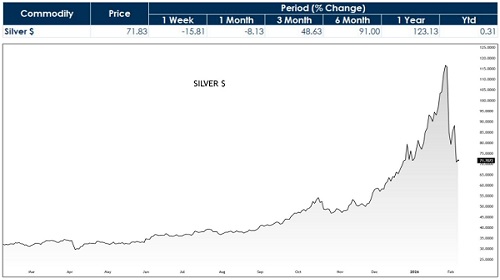
Silver’s sharp selloff in early 2026—falling more than 40% from its late-January peak near $121/oz to around $70/oz—has revived comparisons with the metal’s historic collapses in 1980 (-65%) and 2011 (-35%). While the magnitude of the decline appears familiar, the underlying structure reflects a distinctly modern market dynamic driven by leverage, macro repricing, and rapid capital rotation rather than a breakdown in physical fundamentals.
After opening the year near $72.40/oz, silver surged nearly +68% intra-month to record highs by January-end, fueled by geopolitical risk premiums, strong industrial demand narratives, and aggressive positioning across futures and ETFs. The rally, however, became increasingly momentum-driven as volatility remained compressed and leverage expanded rapidly.
From Structural Story to Crowded Trade
Silver entered 2026 supported by a credible macro backdrop. Industrial demand—accounting for roughly 55–60% of total consumption—remained strong, led by solar installations (+40–45% YoY), electrification, and electronics. At the same time, expectations of easier global monetary conditions and elevated geopolitical tensions revived safe-haven interest.
But as prices accelerated, positioning—not fundamentals—became the dominant driver. Futures open interest expanded sharply, ETF inflows exceeded $3 billion in January, and retail participation surged. By late January, silver had transitioned into a crowded momentum trade, leaving the market highly sensitive to shifts in interest rates, the dollar, and margin conditions.
The Trigger: Rates, Dollar, and Deleveraging
The inflection point came with a sudden repricing of U.S. monetary expectations. A hawkish policy pivot lifted real yields by ~40–50 bps and drove the Dollar Index (DXY) up over 2.5% in 7 days, reversing January’s risk-on narrative. Silver—historically exhibiting a 2.5–3x beta to real yields—reacted violently. As prices broke below key technical levels, exchanges raised margin requirements by 20–25%, triggering forced liquidations. Algorithmic selling accelerated once long-term moving averages were breached, while ETF redemptions added paper supply. Within a week, futures open interest contracted by 35–40%, confirming a classic deleveraging cascade.
Echoes of 1980 and 2011—With Key Differences
The comparison with 1980 is largely about scale. That episode was driven by extreme leverage and concentrated positioning, ending with regulatory intervention. The 2026 selloff, by contrast, was broad-based—spread across hedge funds, ETFs, retail investors, and systematic strategies—with no single dominant player or policy clampdown. The 2011 crash offers a closer mechanical parallel. That decline followed a shift in monetary expectations, successive margin hikes, and rapid liquidation. The difference today lies in demand composition. In 2011, silver was predominantly an investment-driven trade. In 2026, industrial usage forms the backbone of demand, tied to long-cycle themes such as energy transition and electrification—providing a structural floor absent in prior cycles.
A Financial Reset, Not a Fundamental Breakdown
Importantly, the 2026 correction has not been accompanied by a collapse in physical demand or a surge in mine supply. Instead, it reflects the repricing of leverage in a higher-rate environment. Volatility has reset sharply, speculative excess has been flushed out, and price discovery has shifted back toward fundamentals—albeit through a painful adjustment
Technical Outlook: Levels to Watch
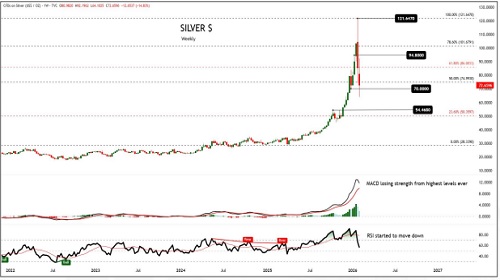
From a technical perspective, silver remains vulnerable as long as it trades below key resistance.
Immediate downside risk: A sustained break below $70/oz could invite further pressure toward the $54.50/oz zone, representing a major long-term retracement and prior consolidation base.
Key resistance: $94.80/oz remains a critical supply zone. As long as prices stay below this level, the broader technical view remains weak-to-neutral, with rallies likely to face selling pressure.
Trend bias: Only a decisive move above $94.80 would signal a meaningful shift back toward bullish momentum.
Bottom line:
Silver’s 2026 crash mirrors 1980 in magnitude and 2011 in mechanics, but structurally it is neither. It is a modern, leverage-driven correction—swift, severe, and financial in nature. As long as silver remains below $94.80, the bias stays cautious, with downside risks persisting if $70 fails to hold