
Sell Gold Below 134000 SL ABOVE 134500 TGT 133500/133000 - Axis Securities Ltd

Macro
• Comex Gold prices touched a one-year low of around $3,856 in the last session and are currently trading flat at approximately $3,867. A hawkish Fed stance and a stronger US Dollar have triggered some liquidation in bullion. We expect short-covering in the counter only if prices sustain above the $4,020 level; otherwise, the metal is likely to continue trading with a negative bias.
• Nymex Crude is trading on a positive note after prices plunged more than 4% in the previous session, as expectations of a global supply surplus continued to outweigh concerns over potential attacks on oil infrastructure and shipping in the region. The global oil market recorded its first supply surplus since February in October, supported by improving supply conditions. Market participants will closely monitor the upcoming inventory data for further cues on the demand-supply outlook.
• Copper prices extended losses as AI investment worries, a firmer US dollar and weak economic data from top consumer China weighed on the market. The dollar scaled a fresh 19-month peak against a basket of peers amid bets for more aggressive policy tightening by the US Federal Reserve. A stronger dollar makes greenback-priced metals more expensive for buyers overseas.
Panel One
* 15-minute candlesticks for a rolling three-day period have been plotted.
* Blue horizontal line shows an open gap which could either be up or down (open-gap up: low of next candle does not overlap the high of the prior candle, and vice versa for an open-gap down). The horizontal line showing the gap will only appear if the price has not visited the gap area.
Panel Two
* Plots the Slow Stochastics study to identify overbought (90 and above) and oversold (20 and below) areas.
* Signals are generated when the fast line (black) crosses the slow line (blue).
Panel Three
* Plots the Fisher Transform study that helps identify extremes and makes turning points clearer.
* Red bands lie between +2 and +3 and can be thought of as an area where a peak could occur. Green bands lie between -2 and -3 and often mark bottoms.
Gold
SELL GOLD BELOW 134000 SL ABOVE 134500 TGT 133500/133000.
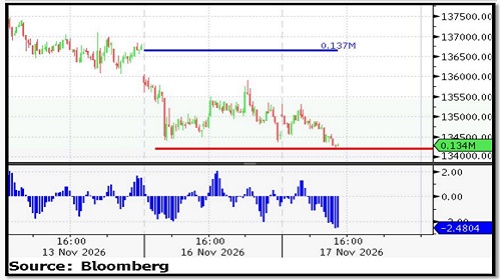
* Nearby Support: 1,34,000/ 1,33,400
* Nearby Resistance: 1,35,000/ 1,35,600
* Nearby Gaps: None
Silver
SELL SILVER BELOW 168000 SL ABOVE 169000 TGT 167000/166000.
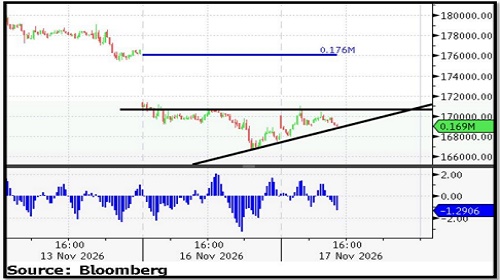
* Nearby Support: 1,68,000/ 1,66,000
* Nearby Resistance: 1,70,500/ 1,72,000
* Nearby Gaps: None
Crude Oil
BUY CRUDEOIL ABOVE 8100 SL BELOW 8020 TGT 8200/8400.
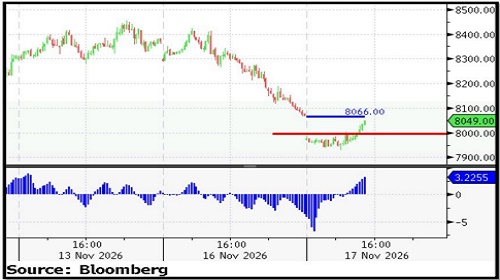
* Nearby Support: 8,000/ 7,900
* Nearby Resistance: 8,150/8,300
* Nearby Gap(s): None
Copper
SELL COPPER AROUND 1286 SL ABOVE 1292 TGT 1280/1270.
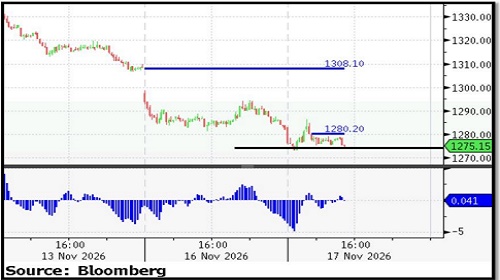
* Nearby Support: 1,270/ 1,260
* Nearby Resistance: 1,285/1,295
* Open Gap(s): None
For More Axis Securities Disclaimer https://simplehai.axisdirect.in/disclaimer-home
SEBI Registration number is INZ000161633